►
From YouTube: NuPIC Critic: 2014 Spring NuPIC Hackathon Demo
Description
Matt Taylor's hack, which didn't actually work. Source code at https://github.com/rhyolight/nupic.critic
A
Okay,
so
I
took
these
songs
and
I
just
used
WAV
files.
Wav
files
are
just
essentially
long
files
of
bits,
so
you
can
do
a
lot
of
interesting
things
with
them
and
I
ended
up
processing
the
each
wave
file
to
create
sort
of
a
spectral
analysis
of
the
frequency
distribution
by
time.
Samples
I
can
sort
of
show
you
what
that
looks
like
on
this
file.
A
I
use
Steve
rice
Donna
as
one
of
my
songs,
so
so
this
is
taking
that
wave
file
and
it's
going
to
show
you
a
spectrogram
over
time
of
the
frequencies
from
0.
All
the
way
well
are
from
80
down
to
8,000,
Hertz
I.
Imagine
so
the
colors.
The
bottom
is
time
and
seconds
there's
a
lot.
This
was
for
songs
and
all
part
of
one
composition.
A
So
you
can
see
some
of
the
transitions
in
here
where
there's
differences,
where
the
there's
disruptions
and
the
theme
so
I
needed
to
try
and
get
this
somehow
in
a
format
that
new
pic
could
understand.
But
this
was
just
too
much
data.
There's
like
twenty
one
thousand
fields
and
just
one
time
slice
here.
So
what
I
ended
up
doing
was
creating
a
histogram
of
that
of
all
of
those
fields.
Just
creating
10
buckets
and
the
number
of
values
within
each
bucket
was
what
I
fed
into
new
pics.
A
So
it
gives
a
representation
of
sort
of
the
frequency
distribution
within
a
time
slice
and
there
were
five
samples
per
second,
so
it
was
a
pretty
fast
stream
of
data
so
and
that
looked
like
in
the
end
I
crash
out.
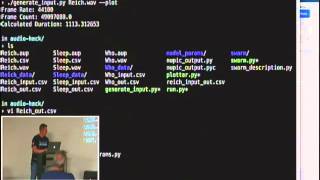
So
my
input
file
looks
something
like
this
seconds
on
the
as
the
first
column
from
the
beginning
of
the
song.
So
you
can
see
there's
about
five
samples
per
second
and
then
buckets
from
zero
to
nine,
so
10
buckets
they're,
not
necessarily
ordered
here
and
then,
but
showing
you
the
wrong
file.
A
A
Look
like
this
I'm
still
debugging
these,
because
because
it
doesn't
work
okay,
but
it's
I
wanted
a
temporal
anomaly
inference
tight
and
it
did
encode
three
of
the
fields,
so
I
told
it
to
swarm
against
bucket
three,
because
that
seemed
to
be
a
good
represent
representation
of
a
field
that
was
changing.
A
lot
had
a
lot
of
values
in
it.
So
I
just
picked
that
and
said
and
swarmed
over
that,
and
so
it
encoded
bucket
three
buckets
six
and
bucket
nine.
A
Apparently,
those
were
the
factors
that
affected
its
prediction
of
bucket
three
and
the
rest
of
the
SP
prams
and
TP
grams
I
haven't
really
looked
into
and
in
our
debugging
I
was
just
looking
with
cebu
tie
over
these
things,
trying
to
figure
out
why
my
anomaly
square
is
not
turning
out
the
way
I
want.
So
if
we
look
at,
let
me
just
I'll
just
run
it
now.
A
So
what
I
ran
new
pic
on
this
data,
just
kind
of
off
to
the
side
and
dumped
out
another
file
with
all
of
new
pics
anomaly
scores
for
every
one
of
these
infant
rose,
and
then
I
created
this
plotter,
which
will
plot
the.
So,
given
that
the
output
of
the
rice
composition,
it
will
plot
this
and
start
the
song
simultaneously.