►
From YouTube: Cerebro 2: 2014 Spring NuPIC Hackathon Demo
Description
Chetan Surpur & Jeff Fohl.
A
This
is
jeff
full
and
I'm
Shaitan,
and
our
project
is
cerebro
too.
So
sometimes
it's
easier
to
understand
something.
If
you
can
see
it
visually
there's
you
know
it
conveys.
A
picture
is
worth
a
thousand
words,
and
so
the
proj.
This
project
is
a
platform
for
doing
visualizations
of
the
CLA
and
see
of
a
model
of
a
CLA
model
and
I
said
platform,
because
it's
basically
set
up
in
a
way
that
you
can.
Anyone
can
come
in
and
add
their
own
perspective,
their
own
angle,
visualization.
That
shows
a
certain
angle
of
the
of.
A
A
A
Oh
and
I
really
hope
the
colors
show
up
this
time.
We
fiddled
with
it,
but
a
projector
always
seems
to
throw
that
off.
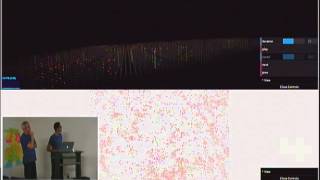
Okay,
so
by
default,
there's
two
angles:
there's
the
3d
view:
yeah
3d
view
up
top
and
a
2d
view
on
the
bottom.
So
what
you
can
do
before
I
actually
go
into
what
you
know
show
this
over
time
is
you
can
take
any
model
all
of
the
CLA
models
and
your
packs?
A
You
can
take
any
one
of
those
and
you
can
just
call
one
function
on
it
and
it'll
and
to
take
its
its
state
over
time
and
export
it
to
some
location.
On
your
on
your
hard
drive
on
your
computer
and
then
you
run
a
server
that
exposes
that
history
of
states
to
the
cerebro
to
web
app,
and
this
is
just
in
the
browser
right.
So
any
CLA
model
you
can
visualize,
that's
what
it
really
means,
and
so
this
is
a
demo
of
the
spatial
pooler,
and
this
is
at
time.
A
A
A
Yes,
very
small,
it's
just
there.
This
is
this,
the
first
time
I'll
get
I'll
show
you
all
Kamen's,
don't
worry,
so
this
demo
is
very
small
just
to
show
you.
You
know
the
first
look
at
this
and
you
can
see
I'll
hit
play
and
you
can
see
over
time.
This
is
a
different
input
comes
in
and
the
special
puller
produces
an
activation
of
the
columns.
You
can
see
these
connect.
B
A
These
are
potential
all
the
potentials
and
the
permanence
is
are
so.
The
color
is
proportional
to
the
permanence.
The
heaviness
of
the
color
is
proportional
to
the
permanence.
So
initially
you
see
all
the
potential
you
can
kind
of
see
there.
You
know
they're
like
very
dim
they're,
they're
initialized
to
be
low,
permanence,
a--'s
and
then,
as
the
training
progresses,
the
permanence
is
get
increased
for
some
of
them
and
decrease
for
others,
and
so
you
get
this
activation
okay.
A
Okay,
so
what's
going
on
here
is
this
is
actually
just
a.
This
is
a
small
version
of
the
one
of
the
projects
I
had
made
earlier
and
the
called
linguist
and
it's
basically
the
topology
of
the
region
or
the
dimension
of
the
region,
is
just
there.
It's
just
a
flat
like
number
of
columns,
so
they're
not
in
a
grid,
and
this
is
kind
of
what
you'd
see
in
groc
as
well.
We
just
have
you
know
a
number
of
columns
and
laid
out
like
that.
A
So
it's
kind
of
hard
to
see
that
so
there's
actually
a
button
here
that
will
reshape
the
space
into
a
more
squarish
version,
so
that
will
be
more
clear
on
the
2d
version,
so
it
reshapes
it.
So
you
can
kind
of
see
all
in
one
screen
and
you'll
see
that
being
useful
later
more
useful
later,
but
you
can
see
that
it's
actually
a
3d
visualization
and
it
shows
now
the
columns
in
2d
and
then
cells
per
column
in
the
third
dimension
and
so
I'll
hit
play
here,
and
you
could
show
different.
I
like
to
play.
A
B
A
So
this
is
an
artificial
example
just
to
show
the
smaller
one
and
I'll
show
a
more
realistic
one
in
a
second
but
basically
I'm,
showing
the
capabilities
of
this
thing.
First,
so
you
can.
These
are
the
active
columns,
so
you
can
change
so
you
can
click
on
stuff
to
change.
What's
visible
and
what's
not
and.
A
A
So
there
we
go
I'll
reshape
this
bottom
one
as
well,
and
so
you
can
see
that
there's
a
lot
of
so
this
is
it
using
the
temporal
played
directly
fluent
uses
template
or
directly.
So
that's
why
there's
no
input,
because
it's
just
showing
the
state
of
the
temporal
puller
and
now
we
can
hit
play
and
you
can
see
it's
I'm,
just
moving
it
around
right
now,
and
so
there
you
go.
These
are
the
the
green
ones
of
the
active
cells.
The
red
ones.
Are
the
predicted
cells
and
it'll
pause
for
a
sec.
B
A
So
some
so
remember
at
the
end
of
the
sequence
and
then
the
end
of
any
given
sequence
is
not
making
a
prediction.
So
in
some
states
it's
making
a
prediction,
because
it's
in
a
sequence
and
in
some
states
for
it
so
right
now
is
make
your
prediction:
when
I
hit
next
it
gets
an
activation,
but
that's
the
end
of
the
sequence,
and
so
it's
not
making
a
prediction
there,
and
this
is
a
new
sequence.
It
got
the
activation
and
made
a
prediction
for
the
next
is.
B
A
Of
these
states
are
beginning
operations,
some
of
them
are
during
a
sequence,
so
you
can
see.
Let's
take
for
this
one,
for
example
on
the
bottom.
You
got
these
this.
You
can
kind
of
see
this
red
there's
a
clump
over
here,
and
you
know
there's
clumps
over
here.
So
when
I
hit
next
the
Reds
are
predicted
and
the
actual
activation,
the
green
ones
are
the
ones
that
came
in
through
it
just
shelves
or
columns.
These
are
these
are
columns
so
the
top
ones.
A
B
Right
here
this
is
great
oops.
Oh
yeah!
Stop
there
so
I,
probably
look
above
the
we're
actually
seeing
the
individual
cells
in
the
columns.
Yes
and
then
the
bottom
picture
you're
collapsing
them
all
into
it
too.
So
any
any
cell
is
predicted
in
the
column,
it
shows
read
any
cell
active
in
a
column.
It
shows
green
on
the
bottom
picture,
but
any
up
above
I
could
actually
see
what
they
are.
Yes,.
A
A
Yeah
and
both
yeah
both
are
backed
by
the
same
data
source.
Let's
see
if
I
can
see.
I
saw
some
really
cool
examples
here.
So
here's
a
prediction
and
let's
see
if
I
can
let
me
find
a
good
one.
I
saw
one
where
the
activations
were
really
clearly
yeah,
okay,
so
this
one's
a
good
one.
Look
over
here,
there's
a
red
clump
there,
there's
some
red
over
here.
A
These
were
these
are
the
predicted
columns
and
then
the
actual
activation
that
came
in
to
the
green
really
matches
up,
and
so
this
was
a
good
prediction
and
the
reality
didn't
match
the
prediction,
and
so
you
can
step
through
and
see
that
kind
of
behavior.
So
this
would
be
the
start
of
a
sequence
predicted
here
and
see
the
I'm
looking
at
the
bottom
left
here.
This
was
a
prediction
and
when
I
had
next,
this
is
the
actual
activation.
So.
B
Know
it'd
be
really
great
enhancement.
I
may
be
very
thing
about
this
if
you
could
just
select
a
little
part
of
the
region,
a
bluff
select
a
little
region,
the
lower
left
and
then
only
show
that
expanding
up
above
because
navigating
to
a
really
large,
you
know
sheet
of
cells
like
that's,
that's
pretty
tough,
yes,.
A
B
A
Yes,
so
there's
there's
one
major
feature
that
I
wanted
to
get
done,
but
it
didn't
have
time
to
I
call
it
ghost
mode
and
basically,
at
any
given
point
in
time
you
can
hit,
let's
say,
pin
or
something
right
or
you
know,
save
the
ghost.
For
that
point
in
time
you
can
go
somewhere,
it's
on
another
point
in
time
and
it
will
overlay
that
saved
one
on
the
current
right
and
you
can
see
the
difference
between
the
two
and
it
will
show
the
difference
in
it'll.
A
Basically
do
a
diff
and
the
similar
ones
me
in
a
particular
color.
The
different
ones
will
be
in
a
different
color
and
so
you'd
be
able
to
see.
So
you
could,
let's
say,
save
this
state
as
a
ghost
and
then
go
next
and
then
overlay
the
predicted
columns
from
the
previous
ghost
to
the
act
of
columns
in
the
current
state,
and
that
would
give
you
this,
like
the
overlap
between
them.
You.
B
A
A
A
A
A
B
A
Know,
but
that's
why
so
for
this
demo,
I
just
have
the
realistic
picture
what's
what
actually
going
on,
but
there
would
be
a
number
of
very
useful
abstractions,
like
heat
maps
and
things
like
that
that
you
could
overlay
on
top
of
this,
you
know
or
add
as
different
visualizations.
That
would
be
helpful
in
debugging
and
understanding.
What's
going
on
at
a
deeper
level.
Well,.
A
A
This
is
a
bursting
column
and
then
the
temporal
puller
is
selected
one
cell
and
that
call
not
a
person
calm.
This
is
that
this
column
was
selective
us
at
spatial
polar.
So
this
column
is
active,
that
temporal
polar
selected,
this
cell
in
the
column
and
then
there's
some
all
greens,
I,
don't
know
if
I
could
find
one
looks
like
it
locked
in
pretty
good
on
this
on
the
context
here,
but
there's
some.
If
you
saw
all
greens
that
would
be
a
burst
in
column,.
A
Yeah,
so
that's
that
and
I
just
really
wanted
to
I
wanted
to
quickly
show
what
the
architecture
of
it
looks
like.
So
you
understand
one
really
cool
thing
about
this
is
I'll
get
to
that
in
a
sec.
It's
the
way
it's
laid
out.
You
have
your!
You
have
your
model
anywhere
and
you
just
the
cerebro
to
server
comes
with
a
function
called
patch
that
you
just
called
one
line
of
code.
You
call
it
on
your
model,
Celia
model
or
you
can.
A
C
A
The
web
browser
that
you're,
seeing
it
communicates
with
the
server
and
the
server
reads
those
states
from
the
file
system
and
returns
those
states
to
the
browser,
which
means
this
can
be
running,
live
producing
data
and
independently.
This
can
pull
whatever
data
is
available
and
send
it
to
the
client,
which
means
you
can
see.
A
running
model
live
any
model
and
another,
and
the
other
key
thing
cool
thing
about
it
is
that
this
web
browser
can
be
anywhere
in
the
world.
This
server.
A
It
just
has
to
be
able
to
communicate
with
the
server,
and
it
could
be
on
different
domains
too,
because
it's
using
a
JSONP
protocol,
and
so
that
means
you
can
have
a
saved
model.
Let's
say:
you've
run
them
on
a
model
demo
model
you
wanted,
and
you
have
all
the
data
on
the
file
system,
and
then
you
can
host
the
server
with
that.
A
It's
a
platform,
you
can
add
more
visualizations
and
you
don't
have
to
do
any
of
this
work
and
the
visualization
will
just
get
the
entire
model
state
and
can
do
what
it
wants
with
it.
The
model
history
and
do
what
it
wants
with
it,
backed
by
the
same
data,
store
so
yeah
they.
This
is
really
extensible
and
can
use
it
for
stuff.
That's.