►
From YouTube: Cerebro for NuPIC
Description
A CLA visualization tool for the Numenta Platform for Intelligent Computing.
B
B
B
A
B
Another
client
of
the
opf,
which
is
our
core
framework
or
a
tool
for
finding
news.
It's
actually
all
of
these
things.
It
is
all
of
the
above,
basically
cerebro.
What
it
does
is
it
allows
you
to
create
data,
sets
and
and
run
cla
models
over
them,
allowing
you
to
edit
the
different
parameters,
all
the
little
itty-bitty
parameters
that
we
swarm
over
or
even
ones.
B
As
the
data
came
in
and
the
movie
x-men
it's
used
for
finding
means,
and
so
real
quick
just
right
now,
before
pre-open
source,
it's
located
in
project
cerebro
to
run
it
super
simple:
you
do
python
cerebrum,
you
specify
a
port
number
and
it
is
a
local
web
application.
It's
not
built
to
actually
be
hosted
yet
there'd
be
some
trickery
to
have
that
happen,
but
you
can
just
download
it
right
locally
and
then
go
to
your
browser
and
go
to
localhost.
Convert.
B
B
B
Parameters
and
actually
you
can
load
two-
you
can
load
a
base
description
file
and
you
can
load
what
we
call
the
sub
description
files
that
kind
of
override
some
parameters,
which
is
usually
what
we
get
pre
and
post
swarm
the
base
description
files.
What
we
get
pre-swarm
just
specifies
everything
and
the
the
sub
description
files
usually
get
after
this
form.
That
tells
you
what
specific
parameters
this
form
found.
B
D
A
A
B
A
B
B
B
B
C
B
Parameters
so
at
the
top
we
have
the
classifier
parameters
alpha
the
steps
that
it's
trying
to
predict.
You
can
see
here
it's
a
temporal
anomaly
model
and
then
all
the
encoder
parameters
are
here
so
for
consumption.
You
have
your
n
and
your
w.
It's
an
adaptive
scale!
Encoder!
You
can
look
at
the
impacts
of
that.
A
B
B
D
B
A
B
B
A
B
B
B
B
D
B
A
D
A
B
A
B
A
B
A
B
B
B
D
B
So
you
can
just
confirm
what
your
suspicions
were
about.
What
data
is
going
in
and
right
now
we
just
have
the
inferences
of
what's
coming
out.
So
there's
no
anomaly
label.
We
can
see
what
the
anomaly
score
is
should
match.
What's
in
that
graph,
you
can
see
what
the
multi-step
predictions
are.
So
each
time
set.
What
were
the
predictions.
B
B
D
D
B
D
B
A
B
Field
to
be
called
foo,
say
fields,
foo
is
t
mod
5
and
you
say
I
want
to
run
that
for
200
iterations,
you
say
create
it,
and
now
it's
created
that
model.
You
see,
you
can
see
all
the
parameters
on
the
left
side.
Here
it's
created
a
multi-step
prediction
model
which
is
with
some
basic
encoder
parameters
and
everything.
This
is
just
the
default.
B
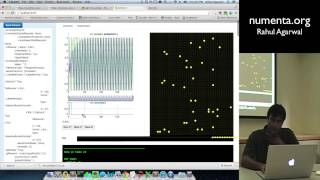
Unfortunately,
for
the
running
code
here,
like
the
scrolling
code,
isn't
working,
but
it's
running
all
of
them
in
here
we
have
basically
200
records
of
the
green,
the
solid
and
then
the
blue
are
predictions.
So
you
think
it's
a
while
for
us
to
catch
up
there,
but
and
then
the
same
as
before.
You
can
step
through
and
see
what
all
the
different
references
are.
You
can
see
foo
at
the
bottom
here
you
can
see
the
different
encoding
outputs,
it's
getting
as
we.
B
A
B
A
B
A
B
A
B
A
A
B
I
can
go
through
and
it
tells
me
like
you
know,
what's
connected
how
many
things
are
firing.
What's
the
density
yeah
inside
the
individual
radius
so-
and
I
get
that
now
at
every
point-
it's
a
little
slow
when
I
try
to
scroll
through,
but
you
can
see
like
this
is
at
0.56
like
if
you
just
check
me
a
little
hard
here.
Give
me
a.
A
B
B
So
here
you
can
see
which
cell
like
at
each
point
which
cells
were
connecting
to
which
other
cells,
if
backtracking
was
happening,
it
had
to
go,
it
lost
the
sequence
I
had
to
go
back.
It'll
tell
you
that
they
can
tell
you
which
columns
are
bursting
or
which
new
segments
are
created,
and
you
get
again
you
get
that
as
a
play-by-play
for
every
record.
So
you
can
see
why
it's
learning
why
it's
not
learning?
D
B
B
B
B
B
B
B
So
that's
like
a
good
way
to
simulate
the
noise
from
because,
in
all
of
our
customer
data,
you
never
have
super
clean
data
like
there's
always
a
little
bit
of
variability.
So
you
can
simulate
that
here
and
see
how
it
affects
the
learning
and
you
can
see
it
takes
a
little
bit
longer
to
learn
because
of
all
the
different
sequences.
Now.