►
Description
Watch an update on What’s New in IBM Cloud Pak for Data as the new release comes out, as well as demos! IBM Cloud Paks are built on and optimized for OpenShift Container Platform.
Chapters
0:00 Introduction
1:48 Overview What's New in Cloud Pak for Data v 3.5? ( including Operators)
14:15 Operator Demo in v 3.5
19:12 See it in action - End-to-end Cloud Pak for Data
54:38 Fire-side partner chat with Tech Data on why they choose Cloud Pak for Data
Speakers: Clarinda Mascarenhas (IBM), Partha Komperla (IBM), Travis Jeanneret (IBM)
Special Guest: Clay Davis (Tech Data)
Host: Karena Angell (Red Hat)
A
Welcome
everybody
to
another
openshift
commons
and
today
we're
really
excited
for
the
ibm
cloud
pack
for
data
team.
So
this
new
release
has
been
eagerly
anticipated
for
all
of
ibm's
customers
and
cloud
pack
for
data
users
and
we're
here
with
clarinda
masquerinas,
offering
manager
of
ibm
cloud
pack
for
data,
as
well
as
clay
davis
from
tech
data
very
important
partner.
A
B
B
So
in
today's
session
we
will
showcase
the
highlights
of
cloud
factory
data
version,
3.5
release
with
a
quick
demo
of
the
deployment
using
our
operators,
which
is
one
of
our
new
capabilities
and
how
it
ties
into
red
hat
marketplace
and
we've
also
onboarded
this
release
in
3.5
on
our
global
distributors,
tech,
data's
marketplace
and
we'll
hear
from
clay
on
white.
Our
factory
data
is
important
to
them,
followed
by
a
quick,
end-to-end
demo.
That
travis
will
walk
us
through
now.
We've
come
a
long
way.
B
B
B
You
know
we
tried
to
build
the
best
tools,
coin
solutions
for
the
different
use
cases,
but
clients
wanted
to
build
a
more
comprehensive
use
case,
driven
platform
that
had
to
go
through
the
pain
of
piecing
these
services
together,
and
so
since
two
years,
our
positioning
is
more
from
a
platform
perspective
with
cloud
factor
data,
and
many
of
you
must
have
heard
about
cloud
facts
itself
which
are
predefined
use
cases.
We
have
six
other
cloud
packs
it's
to
deliver
our
end-to-end
experience
with
a
pre-integrated,
unified
experience
to
end
users.
B
I
wanted
to
quickly
give
you
guys
also
a
feel
for
what
our
data
and
ai
platform
is.
As
we
start
from
our
foundation,
which
is
based
off
open
shift
cloud.
Packer
data
is
truly
a
hybrid
offering
which
can
run
on
any
public
cloud
on
premises,
avoiding
vendor
lock-in
and,
as
you
can
see
in
the
three
boxes
here
that
we
have,
we
have
data
management
services.
B
Well,
like
it
said,
you
know
it's
important
to
understand
your
data
that
is
actually
required
for
ai
and
it
needs
to
be
trusted
so
that
you
can
then
analyze
it
to
build
self-service
analytics
and
the
last
section.
The
last
box
is
analyzed
with
our
data
science
and
analytics
support
for
best-in-class
tools
and
open
source
frameworks
that
allow
you
to
run
your
models
across
a
variety
of
different
environments.
B
B
3.5
supports
openshift,
311
and
4.5,
and
besides
our
different
deployment
options
that
I
just
called
out.
We
are
also
introducing
our
support
for
z,
this
release
and
also
we
run
on
storages,
including
the
openshift
container,
storage,
portworx
and
nfs,
and
we've
seen
a
bit.
You
know
with
our
growing
ecosystem,
also
on
boarding
on
the
tech,
data,
marketplace,
etc.
B
Now.
The
next
thing
I
quickly
wanted
to
cover
is:
if
you
need
an
overview
of
the
latest
packaging
and
where
the
capabilities
lie
in
3.5
version
3.5,
we
have
some
base
capabilities
like
you
can
see
over
here,
and
then
we
also
have
extensions.
I
give
a
simple
analogy
similar
to
your
iphone.
We
have
default
apps,
which
are
part
of
your
base
services,
and
you
always
have
premium
services
which
are
like
extensions,
and
all
these
services
are
pick
and
choose
pre-integrated.
B
It's
a
land
and
expand
model
based
on
your
needs.
This
release.
We
are
introducing
new
services
in
the
base
that
you
can
see
highlighted
with
data
management.
Console
we'll
see
details
of
that
in
a
bit
in
the
ai
portfolio.
We
have
the
wmla,
the
watson,
machine,
learning
accelerator
for
deep
learning,
use
cases
as
well
as
data
privacy
enhancements
and
then,
from
an
extensions
perspective.
B
We
are
introducing
knowledge
accelerators
for
different
industries
for
business
vocabulary
and
then
open
pages,
which
is
actually
one
of
our
grc
solutions
and
also
an
oil
gas
solution
that
we're
introducing
this
release
now
quickly.
Just
to
summarize,
you
know
what
are
the
high
level
themes
in
cloud
pack
for
data
this
release,
given
the
times
we
are
in,
we
are
seeing
a
trend
of
companies.
They
are
even
in
a
survival
mode.
B
You
know
with
the
new
normal
or
in
there
in
an
accelerated
growth
mode
and
having
said
that,
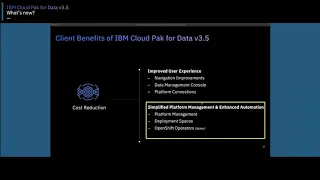
our
two
high-level
themes
to
cater
to
both
these
types
of
needs
are
the
cost
reduction
strategy
and
the
innovation
strategy,
and
you
can
see
from
a
cost
reduction
perspective
and
we
will
cover
the
details
of
each
of
these
themes
and
areas
in
a
bit.
Businesses
are
looking
to
optimize
their
costs,
primarily
through
automation
or
is,
or
moving
to
cloud
to
optimize
their
infrastructure
and
they're.
B
The
first
important
thing
I
want
to
call
out
here
is:
you
can
see
on
the
left
hand
side,
you
have
many
different
pain
points
when
you
use
the
platform
and
you
have
data
located
on
many
different
servers:
public
clouds,
many
different
user
interfaces
for
different
users
and
it's
painful
for
end
users
to
get
their
job
done.
You
know
very,
very
seamlessly,
and
so
you
can
see
on
the
right
hand.
Side
here
is
our
unified
user
experience
based
on
the
job
role
and
permissions.
B
The
next
capability
that
I
wanted
to
cover
is
in
in
terms
of
our
unified
experience
is
for
data
engineers.
We
wanted
to
give
them
a
unified
way
to
manage
the
databases
in
one
place
and
without
this
tool
you
know
it's
called
the
data
management
console.
You
might
need
multiple
consoles
to
manage
native
databases
running
on
the
platform.
So,
with
this
unified
data
management
tool,
you
can
use
it
to
manage
data
virtualization
connecting
to
any
sources
that
are
on
public
clouds,
on
premises,
etc.
B
Your
db2
databases
on
the
platform,
you
know
to
run
your
queries
to
monitor
the
performance,
and
this
new
console
is
actually
built
on
a
full
set
of
open
restful
apis.
So
anything
you
can
do
on
the
interface.
You
can
also
do
that
to
our
open
apis
so
from
in
short,
in
all
from
receiving
alerts
and
monitoring,
hundreds
of
databases
and
optimizing,
the
performance
of
them
from
one
screen,
providing
you
a
single
view
across
the
enterprise
to
even
creating
altering
and
managing
your
database
objects
through
the
single
interface.
B
So
this
is
a
great
value.
Add
for
us
on
our
platform.
The
next
important
capability
we
have
is
platform
connections.
Again,
there
are
two
main
goals
here.
We
wanted
to
make
sure
that
we
use
a
common
mechanism
of
connectivity
across
all
our
services
on
the
platform
and
a
common
set
of
connectors
across
those
services,
and
if
you
want
to
find
a
set
of
these
connectors,
they
are
available
on
our
knowledge
center.
Please
feel
free
to
take
a
look.
B
It
includes
ibm
third
party,
all
different
types
of
connectors,
as
well
as
custom,
jdbc
connections
that
you
can
define.
The
goal
is
primarily,
you
can
define
once
and
make
it
available
in
a
catalog
where
you
can
use
it
from
anywhere
and
the
main
problems
this
is
trying
to
solve
is
primarily
around
reusability
and
streamlining
the
use
of
data
sources
across
our
platform.
B
B
So
you
know:
we've
seen
in
the
past
system.
Administrators
and
end
users
often
have
a
lot
of
difficulty
in
operationalizing
and
managing
their
data
and
ai
workloads.
So
this
has
been
one
of
the
pain
points
and
what
they've
done
this
release
is.
We've
introduced
a
couple
of
capabilities.
One
is
through
our
platform
management.
B
You
know,
system
administrators
on
containerized
platforms.
They
have
many
services
deployed
and
different
resource
consumptions
and
entitlements,
and
they're
very
complex
to
manage
on
your
own.
So,
besides,
providing
the
capability
to
drill
down
from
service
to
power
level
to
debug
and
correlate
the
issues,
administrators
also
require
visibility
and
control.
B
So
what
we've
introduced
this
releases,
we
are
also
giving
the
capability
to
configure
resource
quotas
on
cpu
and
memory
for
the
entire
platform,
as
well
as
individual
services.
That
way,
you
can
monitor
your
thresholds
and
receive
email
alerts
when
usage
exceeds
the
config
configure,
coders
and
optionally.
You
can
also
configure
a
scheduling
service
to
enable
a
soft
enforcement
of
these
coders.
B
That
way,
you
know
you
aren't
exceeding
what
you've
actually
allocated.
So
this
is
one
of
the
great
capabilities.
This
release,
the
other
important
capability
from
a
management
perspective,
is
oftentimes
they've,
seen
that
a
lot
of
the
data
science,
workloads
etc
that
are
running
in
production.
They
we
need
to
make
it
easy
to
monitor
it
as
well
as
manage
it
over
a
period
of
time.
B
Now
the
next
important
capability-
and
I
won't
speak
much
to
it
because
sparta
is
going
to
walk
us
through
this
demo-
is
our
cloud
pack
for
data
operator.
It's
an
olm
based
operator
for
faster
deployment
and
configuration
allowing
you
to
install
uninstall
patch
and
scale
in
an
effective,
as
well
as
an
automated
scalable
way.
So
let's
read
an
action
over
to
you
partner.
C
This
is
the
first
time
clock
pack
for
data
has
adopted
the
operator
framework
for
installation
and
upgrades,
which
makes
it
easier
for
customers
to
adopt
the
platform
and
get
started
in
a
quick
way
and
makes
installs
and
upgrades
easier.
Historically,
we
have
been
using
a
public
tool
based
installation,
and
this
is
the
first
release
where
we
have
adopted
the
operator
framework.
So
in
this
demo
we
have
the
red
hat
red
hat
marketplace
way
of
installing
the
cluster.
C
So
here
I
have
registered
the
openshift
cluster
in
in
this
marketplace
console.
So
let
me
just
show
you
how
the
experience
is
so
when
I
click
on
the
cluster
console,
it
will
take
me
take
me
to
the
openshift
cluster.
While
that
opens
up,
we
can
go
to
the
software
that
I
have
installed
already
on
my
red
hat
marketplace
dashboard.
C
C
I
just
click
on
the
install
operator
and
what
happens
is
it
takes
me
to
a
page
where
I
can
select
the
openshift
project
that
I
want
to
install
it
in
using
the
olm
mechanism?
So
here
I
I
select.
The
openshift
project
called
the
cloud
pack
for
club
type
demo
and
the
installation
is
started
immediately
and
in
a
couple
of
minutes
the
operator
is
installed
and
is
ready
for
use.
C
It
also
links
out
various
storage
and
resource
requirements
to
the
ibm
knowledge
center,
where
user
can
look
at
what
are
the
resources
required
and
what
is
the
security
constraints
that
that
the
platform
uses
so
I'll
quickly
go
and
create
the
control
plane,
wherein
I
need
to
specify
the
the
service
name
that
that
I'm
interested
in,
namely
the
control
plane
in
technical
terms,
it's
called
light.
I
specify
the
storage
class
and
then
I
just
accept
the
license
terms
and
conditions.
C
C
B
Thank
you
so
much
partha
and
I
request
everyone.
If
you
want
to
try
out
this
operator,
we're
going
live
on
the
red
hat
marketplace
on
december
10th,
so
you
can
try
it
out.
We
have
a
trial
as
well,
maybe
travis.
Why
don't
you
quickly
show
us
a
quick
demo
of
the
end-to-end
platform?
Travis.
Do
you
mind
sharing
your
screen.
D
Hey
good
afternoon,
everyone,
my
name
is
travis
generet.
I
am
a
senior
architect
with
ibm,
focusing
around
our
data
and
ai
portfolio,
and
today
I'm
going
to
walk
through
a
quick
15-minute
demo
for
you
around
cloud
pack
for
data
all
right,
so
I'll
start
off
with
a
couple
of
slides
and
kind
of
set
up
the
stage
for
the
demo.
So
let's
talk
through
what
do
you
need
in
the
data
and
ai
platform?
Right
from
an
ibm
standpoint?
We
have
a
very
prescriptive
approach.
D
We
break
it
down
into
these
four
overall
domains
around
collect,
organize
analyze
and
diffuse,
and
you
can
kind
of
read
through
the
details.
But
if
you
start
with
the
collect
sites
about
how
you
access
data,
where
the
data
is
bringing
the
data
forward
pushing
workload
down
to
the
data,
it's,
how
do
you
make
data
access,
simple
and
repeatable
from
an
organized
standpoint?
Think
about
that
as
data
ops
right,
so
the
ability
to
discover
data,
understand
your
data
quality
capture
and
publish
that
information
out
to
an
asset
repository
for
reuse
with
the
goal
being.
D
How
can
you
set
up
shopping
for
data
for
your
data
scientists?
Your
data
analysts
and
other
folks
on
the
analyze
side,
it's
all
around,
providing
the
right
tools
to
the
right
people
at
the
right
time.
This
may
be
where
everyone
wants
to
start,
but
without
those
first
pieces
that
are
uncollected
and
organized
your
anal,
your
analyzing
just
isn't
quite
as
valuable.
D
But
if
you
look
at
it,
you
also
want
to
make
sure
that
you
can
now
democratize
that
ability
that,
whether
it's
a
coder
or
someone
likes
to
drag
someone
likes
to
click
that
you
can
access
the
right
tools
for
the
right
skill
level.
So
they
can
get
their
work
done
and
then
a
big
piece
with
that
as
well,
is
also
the
ability,
then
to
collaborate
and
have
reuse.
D
And
the
piece
that
I
love
to
talk
about
is
around
infuse
and
the
biggest
part
about
that
is.
Is
a
lot
of
organizations
will
be
able
to
to
get
the
data
they'll
be
able
to
get
some
good
skilled
data,
scientists
or
others.
That
can
then
get
some
insight
and
then
they
fall
down
with
how
quickly
or
how
not
quickly
it
takes
them
to
actually
infuse
those
that
pieces
of
insight
that
pieces
of
of
knowledge
back
into
the
business
to
give
value
all
right.
And
so
what
is
the
platform
that
does
all
that?
D
So
let's
take
one
quick,
deep,
look
under
the
covers
of
cloud
pack
for
data,
so
you
can
kind
of
see
where
this
is
before
we
go
into
the
demo.
So
at
its
base,
there's
a
control,
plane
layer,
it's
built
upon
red
hat,
open
shift.
That's
now
part
of
ibm
as
part
of
that
there's
a
small
cloud
pack
for
data
specific
control
plane
on
top
of
that,
that
is
a
common
framework
around
backup
and
restore
authentication
workload,
management,
etc,
and
then
the
magic
on
top
happens
first
in
the
base
area
around
cloud
pack
for
data.
D
So
within
those
same
four
domains
collect
organize
analyze
and
diffuse.
There's
various
micro
services
where
each
micro
service
can
be
deployed
independently.
You
can
have
just
one
of
those
running
within
your
environment
or
have
all
of
them,
or
any
combination
thereof
right
so
under
collect
is
thing
such
as
a
streaming
engine.
Data
virtualization
is
very
popular
data.
Warehouse
put
a
spark
engine
in
place,
then
under
organized
it's
one
of
the
industry
leading
platforms
for
data
governance
around
our
watson,
knowledge,
catalog
solution
under
analyze.
D
D
So
under
the
coverage,
those
are
all
various
microservices
that
are
available
and
accessible
through
cloud
pack
for
data.
Now,
let's
get
to
a
demo
where
we
can
see
some
of
those
pieces
right
there
in
action.
So
let
me
just
set
up
my
demo
scenario:
a
fictitious
telecommunications
company,
we're
looking
at
a
marketing
campaign
right
now.
We
have
a
new
phone
release
coming
up
pretty
soon,
but
we
also
have
competitors
that
are
approaching
all
of
our
customers
right.
D
So
our
goal
is
to
get
a
better,
better
understanding,
better
working
and
quick
quicker
to
deploy
propensity
to
churn
model.
I'm
in
this
scenario,
I'm
going
to
do
this
all
in
the
next
15
minutes
for
an
end-to-end
demonstration,
and
so
here's
what
you're
going
to
see
this
is
part
of
the
demonstration
today
right.
So
take
a
look
at
that
same
cloud
pack
for
data.
D
The
first
phase,
we're
going
to
take
a
look
at
is
what
would
be
performed
by
a
data
engineer
or
a
data
steward,
so
we're
first
going
to
use
the
data
virtualization
technology
and
show
how
it
can
connect
to
multiple
data
sources.
Then
we're
also
going
to
show
the
results
of
doing
a
discovery
and
data
profiling
on
those
different
data
sources,
and
you
can
see
then
how
they
would
be
published
for
use
within
the
data
catalog.
D
D
So
for
here
I
can
see
a
bunch
of
different
activities
I
have
going
on
within
my
environment,
I'm
going
to
go
off
into
data
virtualization.
Let's
take
a
peek
there
first,
so
I
went
ahead
and
did
some
pre-works.
I
have
15
minutes
for
this
demonstration,
and
you
can
see
right
here
here
are
a
whole
sets
of
various
databases
and
different
kind
of
data
repositories
that
I
already
have.
Instead
of
some
pre-built
connections.
D
D
If
I
wanted
to
show
how
quick
it
is
to
for
data
engineer
to
take,
say
two
different
databases,
different
tables
and
join
them
together
and
expose
them
as
one
single
view
out
to
an
end
user,
so
they
don't
have
to
do
that
work.
I
can
simply
come
in
notice
that
these
are
the
two
id
fields
I
can
grab
and
drag
and
drop
those
across
each
other
as
the
key
fields.
D
If
I
am
an
sql
expert,
I
can
dive
into
sql
code
and
actually
build
out
my
own
piece
in
here
by
hand
me,
but
I'm
just
going
to
use
the
editor.
That
already
has
those
pieces
there
hit.
Next,
I
can
change
column
names.
If
I
so
desire,
nope
I'm
going
to
hit
next
and
then
now
I
have
an
option
to
go
ahead
and
take
this
new
view
and
publish
it
out
either
as
part
of
an
individual
project
within
the
cloud
pack
for
data
environment.
D
I
can
fulfill
a
data
request
or
I
can
just
save
it
off
into
my
own
virtualized
data,
which,
which
is
what
I'm
going
to
do.
I'm
going
to
call
this
just
a
demo
customer
join
view
and
I
can
hit
create
and
go
out
and
take
a
look
at
that.
So
what
did
that
do
well
that
went
out
now
and
created
this
new
view
that
I
have
right
here.
It's
part
of
my
demonstration.
D
If
I
go
look
at
that
view,
there's
multiple
I
can
set
up
who
can
access
it?
I
can
submit
it
to
a
centralized
catalog
for
multiple
uses.
Let's
go
take
a
look
actually
just
a
a
preview
of
that
data
right,
so
I
have
authority
via
my
id
and
password
to
actually
view
this
data.
You
can
see.
There's
now
16
columns
of
data,
that's
a
combination
of
profile
data
and
billing
data,
so
things
such
as
marital
status,
number
of
children,
estimated
income.
Are
you
a
car
owner,
just
some
basic
information
associated
with
some
subscribers?
D
D
That's
perfect
and
good.
Now
what
I
can
do
is
actually
I
can
take
that
particular
view,
and
I
can
now
either
assign
that
directly
to
someone's
individual
project
or
I
can
just
submit
it
to
the
catalog
and
have
it
be
part
of
an
asset
repository
that
all
users
could
see
and
use
just
for
a
quicker
demo.
I've
already
put
those
pieces
out
there,
so
I'm
not
going
to
kind
of
go
into
those
right
now,
but
one
last
piece
that
I
will
talk
about
around
data
virtualization
is
very
very
powerful.
D
Is
cash
management
right,
so
I
can
actually
come
in
and
see
what
types
of
queries
have
been
running
against
my
data
virtualization
over
the
last
say,
seven
days,
the
last
24
hours
right.
I
can
see
those
pieces
up
in
the
last
60
days.
I
can
say
you
know
what
there's
there's
quite
a
few
queries:
there's
35,
that's
not
using
caching,
it's
actually
taking
between
1
and
10
seconds,
so
I
can
actually
go
in
and
understand
what
those
queries
are
and
create
a
new
active
cache
for
those
particular
queries
or
for
those
particular
tables.
D
Then
I
can
control
my
storage
and
everything
else
about
it.
Right
so
me,
as
a
data
engineer,
I
can
make
it
so
that
the
platform
handles
the
queries
and
takes
pressure
off
of
some
of
my
back-end
systems,
all
right
so
so
far.
So
what
would
I
do
next
with
this
data
right?
Next,
usually,
I
would
go
through
and
then
discover
this
data.
Maybe
I
want
to
profile
and
look
at
the
inequality
associated
with
this
data.
I
went
ahead
and
kicked
off
some
data
quality
jobs
and
already
ran
those
through
the
system.
D
D
So
that's
part
of
the
analysis
that
it
did
was
to
match
terms
to
columns
but
also
went
through
each
individual
column
and
gave
a
quality
score.
So
there's
hundreds
of
pre-built
quality
metrics,
which
you
can
use
as
is
or
you
can
make
copies
of
and
customize
to
your
heart's
content
about
how
you
set
up
your
baseline
for
data
quality,
for
example,
complaints
per
month.
I
can
actually
click
on
it
and
dive
into
a
little
bit
more.
I
can
take
a
look
at
that
data
quality.
D
I
can
take
a
look
at
the
the
frequency
distribution
of
that
data.
I
can
show
that
in
the
graphical
form
right
so
it
it
goes
through
and
it
does
the
analysis
and
pieces
with
this
and
then
it
gives
me
the
ability,
then,
at
the
end,
where
I
can
actually
go
ahead
and
publish
these
data
results
back
out
to
my
data
catalog
for
my
data
scientists
and
teams
to
use
all
right.
So
let's
kind
of
continue
on
here
right.
So
now
I'm
going
to
go
back
and
change
the
role.
D
So
I
was
a
data
engineer
and
I
created
some
data
connections
via
data
virtualization.
I
did
some
discovery
of
data
profiling
of
data
and
published
that
out
to
my
enterprise
catalog.
Now
I'm
going
to
come
back
in
as
that
data
scientist
right
for
my
project
of
making
some
customer
churn
models.
I
first
want
to
go
find
some
data
to
go
out
and
use.
I'm
gonna
take
a
look
at
catalogs,
I'm
gonna
look
into
my
customer
data,
catalog,
hey!
D
So,
for
example,
I
can
see
that
I
can
go
into
what
watson
recommends
based
upon
my
profile,
what
I
normally
do,
I
can
also
go
into
highly
rated
and
see
which
ones
have
some
rating
to
it.
So,
let's
go
take
a
look
at
this
customer
profile
data.
That's
right
here,
given
authority
is
first
going
to
show
me
a
quick
view
of
that
data
itself.
You
can
see
details
of
it.
I
want
to
go
in
and
take
a
look
at
the
review
that
was
done
so
susie
who's.
D
A
member
of
my
data
science
team,
put
a
little
comment
in
here
a
couple
weeks
ago,
saying
how
this
is
the
data
set
that
she
uses
around
customer
history,
which
would
be
good
for
my
my
predictive
churn
model
that
I
want
to
create.
I
can
look
at
the
profile
of
that
data,
so
as
a
data
scientist
without
having
to
dive
into
code,
I
can
see
the
distribution
of
this
data
and,
if
it
makes
sense
for
me
to
want
to
use
this
data
quickly.
D
So,
for
example,
I
can
see
that
myrtle
status
is
pretty
evenly
distributed
across
the
couple
of
options
that
are
in
here.
Estimated
income
has
a
decent
distribution
with
a
min
max
and
a
mean
that's
in
there
and
then
other
things
that
are
in
here
as
well,
such
as
age
month
as
a
customer
membership,
date
etc.
Right.
I
could
also
see
the
lineage
of
that
data,
which
is
going
to
show
me
some
interesting
things
such
as
here's
when
it
was
first
published
to
the
catalog.
D
Here's
where
the
first
data
profile
was
created
and
then
oh
by
the
way,
there's
been
multiple
times
where
this
asset
has
been
used
in
other
projects.
So
I
can
see
that
I
can
even
contact
the
people
to
go
in
and
see
about
what
information
they
have
from
the
past
and
their
experience
using
this
data
format,
all
right,
so
I'm
shopping
for
data.
You
know
what
this
data
is
good
to
go.
I
want
some
individual
data
sets
and
I
also
want
this
joined
data
set.
D
D
Earlier
just
to
speed
the
demo
up,
so
I'm
not
going
to
show
that
now,
but
that's
the
quick
and
easy
way
to
take
data
and
assets
and
quickly
add
them
to
your
project
and
think
about
the
amount
of
time
that
that
saves
you
and
the
ability
just
to
shop
for
data
all
right.
So
data
scientist,
I
have
the
data
that
I
want.
I've
added
it
to
my
project.
D
So
what
is
a
project?
So
a
a
project
is
a
scoped
space.
That's
on
the
server
that
is
specific
to
whoever
created
it
and
then
whoever
they
have
added
as
additional
collaborators
within
your
projects
for
here,
susie,
clarendo
and
amy
are
all
some
of
the
collaborators
that
are
associated
with
this
particular
project.
D
But
a
project
is
a
collection
of
assets
that
only
I
can
see
is
protected
and
then
any
work
that
I
do
will
keep
it
within
the
scope
of
this
project.
But
I
still
have
the
ability
to
publish
results
back
out
to
say
the
original
data
store
or
out
to
the
data
catalog
right
in
this
scenario.
Here
is
all
the
data
assets.
So
here's
like
the
customer
satisfaction
customer
profile.
Customer
billing
here,
is
that
extra
data
set
that
amy
had
created.
For
me,
that
is
a
combination
single
view
using
data
virtualization.
D
I
can
go
and
take
a
look
at
that
as
an
example.
So
if
I'm
a
data
scientist,
I
can
come
in,
take
a
look
at
this
data,
so
this
is
doing
a
real-time
query
back
out
to
that
database
and
pulling
information
back
for
me,
and
I
can
see
profile
with
linux
just
same
kind
of
things
that
I
was
able
to
to
see
before,
but
now
within
the
project
scope
I
can
see
well
what
have
I
done
with
this
data
within
the
project
right
which
published
to
the
catalog?
D
I
can
add
it
to
a
data
flow.
I
can
do
different
things
with
that
data,
but
have
a
lineage
of
what
the
team
has
done
and
how
they've
used
it
within
a
project
space
which
is
which
is
pretty
impressive,
all
right.
So
I
guess
this
is
a
collection
of
assets.
Well,
so
what
kind
of
assets
can
I
put
into
my
project
space?
Well,
let's
take
a
look.
I
can
go
to
add
to
project.
D
D
I
can
do
a
new
modular
flow,
which
is
a
graphical
view
into
into
building
models.
I
can
make
a
new
watson
machine
learning,
a
detailed
model
or
deploy
things
out
for
runtime.
I
can
make
some
visual
dashboards
without
having
to
write
code.
I
can
create
a
new
notebook.
A
data
refinery
is
a
self-service
data
wrangling
tool.
D
The
new
data
set
you
can
see
here
on
the
left
is
called
merge
customer
churn,
so
I'm
going
to
use
that
and
create
a
new
predictive
model
quickly
before
all
my
time
expires
all
right.
So
I'm
going
to
make
a
new
churn
demo
and
I
can
pick
the
configuration
settings
for
eight
cpus,
et
cetera.
Let's
just
go
ahead
and
make
this
four
cpus
to
start
with
and
create.
D
What
if
you
could
use
ai
from
a
click
and
point
and
click
perspective,
and
have
it
build
a
model
from
you
for
you
from
from
scratch?
And
that's
exactly
what
I'm
going
to
do.
So
I'm
going
to
take
a
look
inside
of
my
project
and
here
is
the
merge
customer
churn
data
that
I
want
to
use.
I'm
going
to
select
that
asset.
D
It's
going
to
go
ahead
and
read
that
data
set
for
me
and
it's
going
to
it's
going
to
suggest
here
are
all
the
potential
columns
which
one
would
you
like
to
do
a
prediction
upon
so
for
us
I'm
going
to.
I
want
to
predict
churn,
and
since
it
is
a
representation
of
the
data
as
being
true
and
false,
it
suggests,
what's
called
a
binary
classification
right,
which
is
just
a
a
type
of
algorithm
or
a
type
of
work.
That
just
predicts
between
two
distinct
categories,
which
is
true
or
false.
D
D
As
you
can
see
here,
it's
going
to
go
ahead
and
do
a
90
10
split
for
my
data.
As
far
as
90
used
for
training,
10
percent
hold
out
to
do
for
some
testing
and
things
afterwards
right.
I
can
see
all
the
columns
that
are
going
to
be
part
of
the
the
feature
set
for
my
model
and
I'm
just
going
to
go
ahead
and
just
keep
them
all
for
right.
Now
I
can
do
sampling
if
it's
a
larger
data
set.
I
want
to
use
a
smaller
group
set
to
speed
up
the
results.
D
D
I
could
change
it
and
overwrite
it
to
do
a
multi-class
classification
or
if
it
was
a
different
type,
I
could
have
it
do
a
regression
algorithm
type
as
well,
and
it
has
a
one
of
the
things
that
you
want
to
do.
Is
you
want
to
look
at
well?
How
do
I
want
this
to
judge
what
is
a
success
and
not
a
success
or
the
best
model
that
it
can
find
for
me?
Well,
I'm
going
to
have
it
based
upon
accuracy
right,
that's
the
best
choice
for
a
binary
classification.
D
I
could
also
do
these
other
ones,
and
it
actually
will
show
me
the
results
for
all
of
those,
but
I
want
to
do
it
by
accuracy,
there's
a
whole
set
of
algorithms.
I
want
to
test.
I
can
also
decide
well
how
many
of
these
algorithms
does
it
want
to
put
through
all
the
paces.
I
want
to
go
ahead
and
do
four,
four
algorithms:
it's
going
to
generate
16,
separate
pipelines
of
work
forming
all
right,
so
save
that
hit
run
experiment.
D
So,
what's
that
going
to
do
it's
going
to
go
through
and
do
a
set
of
activities?
Let
me
swap
the
view
into
kind
of
this
tree
kind
of
view.
So
it's
going
to
read
the
data
set.
It's
going
to
take
the
90
10
split
of
that
it's
going
to
read
through
all
that
training
data,
and
it's
going
to
start
looking
at
the
pipelines
that
you're
just
going
to
need
for
the
data
and
it's
to
do
some
pre-processing
she's,
going
to
clean
up
some
of
the
data.
D
Take
a
look
and
see
what's
categorical
and
numerical
do
all
that
kind
of
work
for
you,
so
you
don't
have
to
to
know
about
it.
It's
going
to
pick
the
best
four
algorithms
based
upon
the
data
set
and
the
the
type
of
inputs,
then
for
each
of
those
just
going
to
run
through
some
things.
It's
going
to
first
just
do
a
straight
test
using
that
algorithm
and
see
what
the
result
set
is
and
then
it's
going
to
take
that
result
set
and
then
do
some
hyper
parameter.
Optimization
see!
D
If
you
can
improve
the
model
you
get
a
result
set.
Then
it's
going
to
do
some
feature
engineering
and
get
the
results
of
that
and
then
do
one
more
pass.
On
top
of
that
with
some
additional
hyper
parameter.
Optimization
it's
going
to
do
that
across
all
four
of
the
algorithms
that
it
goes
out
there
and
selects.
So
so
this
could
take.
You
know
10-15
minutes
to
run
so
I'll.
Let
that
run
in
the
background
and
let's
go
take
a
look
at
the
the
same
one
that
I
ran
earlier.
D
So
you
can
see
the
results
of
what
that
looks
like
from
auto
ai
all
right,
so
that
was
still
running
and
this
one
was
completed
a
while
back.
Let
me
open
this
one
up
and
show
you
the
result
set
from
what
it
did
all
right.
So
here's
the
same
model,
the
same
results
that
the
other
ones
should
be
able
to
get
as
well
as
you
can
see
that
there's
four
different
algorithms
right
here
that
it
shows
xgb
classifier
gradient,
boost
random
forest
lgbm
and
iran
through
each
of
those
and
the
starred.
D
One
right
here
is
the
one
that
it
gave
as
the
as
the
number
one
result
set
from
the
work.
That
was
done.
I
can
also
swap
the
view
if
you
want
to
get
it's
a
different
view
into
the
result
set
which
includes
here's.
The
lgbt
classifier
here
is
the
model
that
it
did
and
it
shows
you,
the
the
feature
transform
transformations
and
the
hyper
parameter
optimization
that
it
did
as
part
of
that,
so
you
can
actually
go
through
and
see
that
the
details
of
all
the
ones
that
it
worked
through.
D
D
D
So,
instead
of
doing
that,
let
me
kind
of
go
back
here
and
let's
take
a
look
down
below,
because
here's
all
the
16
of
the
pieces
that
were
run,
here's
the
ranking
order
of
those
16,
along
with
the
accuracy
that
was
came
out
of
it
so
pipeline
15
using
the
lgbm
classifier
with
the
first
pass
to
run
the
hyper
parameter,
optimization
plus
the
feature
engineering.
I
can
actually
open
that
up.
Let
me
just
dive
into
a
little
bit
deeper,
so
you
can
see
it.
D
D
I
can
take
a
look
at
what
were
the
features
that
it
created,
so
a
combination
of,
say
estimated
income,
how
many
months
as
a
customer,
late,
payment
charges
so
on
and
so
forth
then
feature
importance.
So
this
actually
will
tell
me
which
features
were
important
as
part
of
this
as
part
of
this
model
that
was
created
right,
so
estimated
income
actually
had
the
biggest
overall
impact
on
whether
or
not
that
person
was
going
to
churn
right,
an
interesting
thought
who
would
have
known
that
before,
but
it
does
make
sense
right.
D
It
may
put
him
in
a
different
social,
economical
class.
He
may
have
the
funds
or
the
ability
to
potentially
change
carriers
easier
or
maybe
not
right.
So
those
are
the
results,
and
I
can
take
this
and
I
can
actually
now
take
and
save
this
off
as
a
model
back
into
my
project
space.
So
this
now
would
be
a
standalone
model
that
I
can
now
deploy
as
an
online
model.
D
This
is
a
demo
model,
I'm
going
to
save
that
off
into
my
space,
but
before
so
before,
we
take
a
look
at
that.
Let's
say
that
I'm
a
data
scientist,
but
I'm
a
coder
right.
I
love
jumping
into
python
and
I
don't
know
if
I'm
going
to
trust
this
or
not.
I
mean
it's
good,
but
I
think
I
can
always
do
better,
which
you
know
maybe
maybe
not
right.
This
is
a
really
powerful
tool,
but
I
can
also
go
take
and
export
this
auto
ai
model
out
as
a
notebook.
D
So
if
I
take
a
look
and
let
that
generate
a
notebook,
let's
hit
create
the
notebook.
This
actually
will
join,
will
come
out
and
show
me
an
entire
notebook
written
in
python.
That
is
exactly
what
the
tool
did
behind
the
scenes,
and
I
can
tweak
that
I
can
rerun
it
there's
all
kinds
of
things
I
can
now
do
within
this
notebook
to
show
that
shows
the
same
result
as
was
done
with
with
the
model
right.
D
So
it's
very
powerful,
especially
with
the
ability
to
see
under
the
covers
on
what
model
that
the
auto
ai
features
built
for
you
all
right.
So
where
are
we
now?
Let
me
go
back
up
to
my
churn
model
and
so
okay.
So
my
my
churn
project
overall
right.
Here's
a
new,
auto
ai
experiment,
this
one's
still
running,
here's,
the
new
notebook
that
I
just
created
based
off
of
that
and
oh
by
the
way
here,
is
that
new
model
that
I
had
deployed
out
to
use
later
on.
D
So
my
next
step
that
I
want
to
do
is
I'm
going
to
promote
this
model.
I'm
going
to
promote
this
model
up
into
what's
called
a
deployment
space,
so
deployment
space
is
where
you
would
go
through
and
actually
deploy
models
as
an
online
or
batch
kind
of
model,
and
you
can
do
it
through
the
tooling
or
through
an
api.
So
you
can
use
jenkins
or
other
kind
of
ways
to
to
automate
the
whole
ml
ops
process.
D
I'm
going
to
promote
that
out
to
the
deployment
space
and
let's
go
take
a
look
at
that
new
deployment
space
that
is
out
there
right.
So
there's
two
assets.
One
asset
is
the
model
I
created
previously
and
it
already
promoted
out
there
and
the
second
one
is
a
model
that
we
just
created.
So
let's
go
through
now
and
I
want
to
go
ahead
and
deploy
that
model
out
to
to
be
an
online
runtime
model.
D
D
So
what
is
this
going
to
do
so?
This
is
going
to
take
that
model.
It's
going
to
package
it
up
within
its
own
container
within
the
cloud
pack
for
data
platform
and
then
go
ahead
and
deploy
that
out
as
a
pod
or
as
a
container
within
the
kubernetes
environment,
and
have
it
be
a
new
online
model,
and
it's
going
to
return
back
to
me
the
the
details
about
that
model
and
how
I
can
access
it
and
test
it
all
right.
D
So,
while
that's
deploying,
let's
just
go
back
to
the
one
that
I
the
one
that
I've
already
deployed
out
there,
so
I
go
into
my
deployments.
Well,
actually
it's
already
done
and
deployed.
So
that's
that
was
quick
and
easy.
So
now
we
have
the
one
we
just
created
is
now
online
as
a
as
a
usable
model.
I'm
going
to
use
the
one
that
I
created
earlier,
because
I
already
have
some
sample
data
ready
to
test
with
it
all
right.
So
the
first
thing
that
I
see
here
is
that
my
model
is
deployed
it's
online.
D
I
think
that
there's
one
copy
out
there
running.
I
could
change
this,
and
so
let's
say
that
I
want
to
have
higher
availability
and
higher
throughput
so
that
there's
multiple
things,
one
access
model.
At
the
same
time,
I
can
actually
create
multiple
instances
or
copies
of
this
out
of
my
environment,
simple
and
easy
to
do
just
by
changing
that
and
hit
save
here
is
the
direct
endpoint
link
as
a
restful
interface
out
to
my
model.
D
So
now
I
can
infuse
that
into
other
applications
and
oh
by
the
way,
here's
some
example
code
snippets
on
how
you
would
go
and
access
access
that
model
from
within
your
own
application.
Here's
a
curl
command.
Here's
some
sample
java
code,
some
sample,
javascript
code
that
you
can
copy
and
paste
python
scala.
So
it
gives
you
some
examples
of
what
you
can
do
to
quickly
infuse
that
into
your
existing
applications.
D
I
want
to
do
a
quick
test
on
this.
Let's
use
the
the
built-in
test
harness
right,
so
I
can
go
through
here
and
type
in
fill
in
the
different
attributes
and
fields
and
test
out
the
results
to
speed
that
up
quick.
What
I
want
to
do
is
I've
already
saved
off
in
json
format,
some
sample
data.
So
let
me
go
do
that
here,
quick
all
right.
D
You
can
see
that
he's
had
zero
complaints
in
the
last
month,
one
complaint
in
the
last
year,
so
your
average
kind
of
customer
I
can
just
hit
the
predict
that
now
went
out
and
tested
my
model
right
and
came
back
with
the
prediction,
and
the
probability
of
that
right
so
that
comes
back
with
is
is
false,
which
means
that
very
unlikely
to
churn,
and
it's
a
99.9
probability
of
that
of
that
of
not
not
churning
right.
I
can
make
some
quick
tweaks
to
this.
D
What
if
I
came
in
and
said
you
know
what
he
actually
had
three
complaints
and
two
complaints
in
the
last
month.
Right,
a
very
you
know,
telltale
sign
of
someone.
That's
unhappy.
Has
a
decent
income
is
married
and
has
the
ability
to
change
carriers
easy,
let's
see
what
happens
from
this
a
very
accurate
model.
D
So
with
those
attributes
you
can
quickly
see
how
this
person
is
likely
to
churn,
and
he
has
a
98.8
percent
chance
999.98.9
chance
to
actually
churn
all
right.
So
so
this
concludes
my
demo,
but
I
just
wanted
everyone
to
see
how
quick
and
easy
it
is
to
look
through
the
entire
life
cycle
of
collecting
data
and
organizing
that
data
and
from
a
data
science
perspective.
D
The
ability
to
use
auto
ai
to
quickly
generate
a
predictive
churn
model
and
then
how
easy
it
is
to
use
the
tooling
or
use
the
apis
to
then
go
ahead
and
promote
and
deploy
that
model
into
a
highly
available
runtime
to
actually
get
its
use
out
there
for
for
the
business
right.
So
thank
you
again
and
hope
you
enjoy
the
demonstration.
B
Thank
you
it.
It
was
really
a
good
overview
of
the
platform
itself
quickly.
We
will
be
moving
on
to
you
know
one
of
our
other
great
achievements.
This
release
is
we've
onboarded
on
the
tech
data
stream,
one
marketplace,
and
I
would
I
would
like
just
to
showcase.
You
know
what
we're
really
doing
with
our
global
distributors,
partners,
etc.
So
clay,
why
don't
we
start
off
with
you
telling
the
audience
about
your
role
at
tech
data
and
before
that
with
ibm.
E
I
still
work
with
ibm
almost
every
day
and
a
lot
of
it
is
around
red
hat
and
cloud
pack
for
data,
and
so
at
tech
data
we're
a
global
distributor
and
there
I'm
responsible
for
leading
our
data
iot
and
ai
practice
globally.
So
I
work
with
both
vendors,
like
ibm
and
red
hat,
as
well
as
our
business
partners
and
resellers,
to
kind
of
optimize
the
impact
that
we
can
have
through
the
channel
ecosystem.
B
E
Yeah
yeah
I'd
love
to
I
mean
look
as
you
know
through
my
my
background.
Compact
for
data
is
near
and
dear
to
my
heart,
so
I
really
love
what
ibm's
doing
with
with
openshift
through
the
cloud
packs.
You
know
even
beyond
just
cloud
pack
for
data,
so
you
know
so
much
so
that
when
I
arrived
at
tech
data
earlier
this
year,
you
know
one
of
my
one
of
my
highest
priorities.
If
not
my
number
one
priority
was
to
ensure
that
the
channel
ecosystem
knew
the
power
of
compacts.
E
E
B
It's
really
exciting.
You
know
tech
data
has
over
a
thousand
global
vendor
partners,
as
we
know,
operating
in
more
than
100
countries,
and
you
know
onboarding
cloud
pack
for
data
on
this
global
iit
marketplace
stream.
One
which
will
help
streamline
the
buying
selling
and
other
services
automated
and
offered
to
the
global
partners
is
awesome.
You
know,
additionally,
as
you're
aware,
you
know
just
what
travis
showed
with
our
hybrid
cloud
ecosystem
strategy.
B
Customization
is
very
key,
and
tech
data
is
definitely
as
as
a
value-added
distributor.
It
meets
our
customers
where
they
are
with
solutions
that
are
more
innovative,
yet
less
costly,
offering
comprehensive
services.
You
know
to
foster
this
wider
adoption
so
to
provide
that
expertise
and
to
help
both
our
business
partners
and
customers
not
only
to
deploy
large-scale
solutions
from
technology
providers,
but
you
guys
are
helping
them
customize
them
just
their
specific
priorities,
not
to
forget.
B
You
know
the
click
to
run
automation
that
we
developed
to
deliver
this
on
the
stream,
one
marketplace
of
tech
data,
which
is
definitely
going
to
be
a
unique
value
for
our
partners,
so
simplifying
some
of
the
most.
I
feel
time
consuming
and
complicated
parts
of
deployments
and
in
automating
complex
processes
such
as
infrastructure
platform
software,
as
a
service
deployments,
building,
connections,
configurations
and
integrations
is
something
that
I
feel
is
really
going
to
cater
to
our
business
partners
and
to
our
clients
so
clean
coming
back
to.
E
E
First,
as
I
mentioned
earlier,
like
we
work
across
our
cloud
vendors,
and
so
we
wanted
to
make
sure
that
we
had
a
solution
that
would
not
only
work
with
right.
The
vendor's
cloud
so
in
this
case
ibm,
but
you
know
azure
and
aws
and
others,
and
obviously
cloud
pack
for
data-
allows
this
openshift
and
second,
we
know
that
more
clients
are
looking
for
that
all-in-one
solution
to
drive
business
outcomes
and
cloud
pack
for
data
accomplishes
this
by.
E
E
You
know
all
before
being
able
to
infuse
that
into
their
organization
to
use
it
in
the
most
effective
way
possible.
So
I
mean
it's
kind
of
a
short
answer,
but
you
know
for
those
two
reasons:
it
really
made
compact
for
data,
a
no-brainer
for
us
to
pursue
and
to
go,
build
this
market
ready
solution
and
put
it
on
our
on
our
ecosystem
platform
and
kind
of
get
off
and
running.
B
E
Yeah
you're
right
clarinda,
I
mean
I
mean
we
probably
can't
say
it
enough,
but
it
really.
It
speaks
that
that
first
reason
I
gave
evolve
right
where
we
can
work
across
cloud
vendors.
You
know
seamlessly
it
speaks
to
the
power
of
openshift
and-
and
this
is
such
a
big
deal
for
our
channel
ecosystem,
and
so
you
know
we.
We
know
that
we
live
in
a
multi-cloud
world,
but
you
know,
especially
when
you
think
about
the
channel.
E
There's
still
a
lot
of
a
lot
of
you
know,
organizations
and
resellers
that
are
still
working
working,
that
out
right,
figuring
out
which,
where,
where
do
they
land?
Where
do
their
customers
want
to
be
right
in
in
trying
to
work?
You
know
through
in
a
business
outcome,
landscape,
so
being
able
to.
You
know.
We
know
that
it's
a
multi-cloud
world.
We
know
that
kubernetes
is
the
future
and
being
able
to
effectively
expose
that
to
the
partner
ecosystem.
I
think
is
really
really
important.
E
So
and
what's
interesting
is
obviously
I
gave
a
little
bit
of
my
background.
But
you
know
I've
worked
with
cloudback
for
data
extensively
in
the
past,
but
I've
I've
been
out
of
the
everyday
for
the
last.
You
know
9
to
12
months.
So
you
know
I'd
be
really
curious
to
hear
you
know
how
it's
going
recently.
You
know
you
covered
the
3.5
release
already,
but
maybe
we'll
start
with.
B
Yeah,
definitely
that's
a
that's
a
very
good
point,
so
let
me
quickly
showcase
what
would
be
my
favorite
capability
in
cloud
pack
for
data,
so
I
think
innovation
is
definitely
one
of
those
areas
that
that
has
been
very
attractive,
so
one
of
the
capabilities
we're
actually
bringing
in
this
release.
Frankly
speaking,
is
our
watson
machine
learning
accelerator
in
the
base
and
it
allows,
I
think
it
allows
you
know
everybody
to
use
deep
learning
on
gpus.
B
It
makes
it
much
more
easier
for
data
scientists
for
this
distributed
deep
learning
architecture
that
simplifies
the
process
of
training,
deep
learning
models
across
the
cluster
for
faster
time
to
results,
as
well
as
powerful
model
development
tools
in
real
time
for
training
visualization,
as
well
as
runtime
monitoring
of
accuracy
and
some
of
the
hyper
parameter
optimizations.
We
just
saw
in
travis's
demo
for
faster
model
deployment.
B
So
I
think
this
is
one
of
the
great
capabilities
that's
coming
in
cloud
pack
for
data,
one
of
the
other
capabilities,
which
is
in
early
stages
by
ibm
research
team,
but
it's
definitely
a
new
cutting
edge
technology
and
it's
a
new
concept
that
I
feel
everybody
should
try
out.
Is
our
federated
machine
learning
capability
which
enables
multiple
organizations
to
train
ml
models
collaboratively
without
having
to
share
data?
And
so
you
can
imagine
what
this
really
means.
B
The
driving
factor
behind
this
is
definitely
data
privacy,
confidentiality
regulations
and
even
the
cost
to
move
the
data
right.
So
it's
machine
learning
without
moving
your
data,
and
you
can
you
know
you
might
have
your
data
on
aws,
ibm
cloud
on-premises
and
without
moving
the
data
from
these
locations,
you
can
have
a
centralized
data,
aggregator
iterate
and
build
and
bring
ml
to
where
your
data
lives.
So
I
think
these
couple
of
capabilities,
I
would
say,
are
definitely
highlights
for
this
release.
E
B
B
You
thanks
so
quickly
before
going
back
to
the
operator
demo,
there
are
a
couple
more
capabilities
I
wanted
to
cover
that
are
coming
in
cloud
pack.
The
data
one
of
them
is
data
privacy
and
many
times
you
know
we.
We
have
seen
the
need
for
a
lot
of
data
protection.
That
means
you
want
to
sometimes
de-identify
your
data
for
data
science.
B
You
want
business
analytics
and
testing
to
be
able
to
done
on
the
same
quality
of
data
that
you
put
into
production,
that
you're
training
your
models
with,
and
so
this
is
one
of
the
capabilities.
That's
tightly
integrated
with
our
watson,
knowledge,
catalog
from
data
sub,
setting
fabrication
for
end
users
and,
most
importantly,
it
aligns
with
our
governance
strategy
to,
and
you
can
even
use
this.
You
know
to
provision
your
data
for
test
data
for
your
models
in
production
with
the
same
level
of
security,
and
this
capability
is
is
very
useful.
B
You
know
we
in
our
governance
portfolio,
we
have
data
quality
data
consumption
more
from
a
self-service
perspective,
and
we
have
data
governance
and
often
times
it's
important,
to
understand
the
business
vocabulary
of
your
technical
data
and
building
the
business.
Vocab
vocabulary
is
more
than
creating
a
word
list
and
it
takes
time
to
create
a
usable
business
vocabulary
with
definitions
and
business
contexts
so
to
quickly
get
you
up
and
running
this
release,
we're
bringing
in
the
ibm
knowledge
accelerators.