►
From YouTube: ML Workflows on Red Hat OpenShift
Description
Red Hat believes that machine learning (ML) workflows are just like traditional software development workflows. In this video we demonstrate how Red Hat OpenShift Container Platform can enable data scientists to leverage traditional DevOps methodologies to accelerate their ML workflows.
A
To
solve
a
problem
with
machine
learning,
data
scientists
and
other
practitioners
use
a
workflow
that
looks
like
this.
They
start
by
formalizing
the
problem
they're
actually
trying
to
solve
and
identifying
the
metrics
that
imply
success.
They
then
collect
clean
and
labeled
the
training
data
to
use
as
examples
before
converting
these
data
into
a
format,
that's
suitable
for
a
machine
learning
algorithm.
A
A
It
will,
let
us
choose
a
t-shirt
size
for
the
resources,
we'll
need
for
our
environment
and
whether
or
not
we
want
to
schedule
a
GPU
Jupiter
hub,
creates
and
maintains
a
persistent
volume
to
hold
our
work,
and
we
can
tell
it
to
clone
and
get
repository
into
that
persistent
volume
before
we
start
up.
Finally,
we
can
specify
some
other
environment
variables
as
well,
we're
not
using
safe
storage
in
this
demo,
but
if
we
were,
our
credentials
would
be
pre-loaded
in
the
environment,
along
with
any
other
environment
variables.
A
We
specify
now
we'll
go
into
the
development
environment
and
look
at
our
work
again.
We've
pre-loaded
some
code
from
a
git
repository.
This
code
is
what
we
call
Jupiter
notebooks,
which
are
interactive
documents
that
include
prose
code,
pictures
and
output,
they're,
a
great
tool
for
experiments
and
a
great
communication
tool
in
this
demo
in
the
interest
of
time,
we're
not
going
to
develop
new
techniques
and
notebooks
we're
just
going
to
use
Jupiter
to
run
and
evaluate
those
existing
notebooks
that
we
cloned
from
git
as
if
we've
gotten
them
from
a
colleague.
A
A
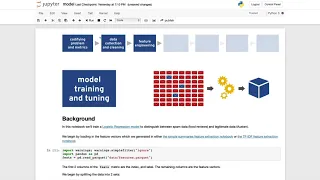
The
next
notebook
actually
trains
a
model
that
is,
it
finds
good
trade-offs
in
separating
the
vectors
corresponding
to
legitimate
documents
from
the
vector
is
corresponding
to
spam
documents
and
thus
learns
a
function
to
label
documents.
When
we're
evaluating
this
model,
we
want
to
look
at
some
of
its
performance
metrics
on
data.
It
hasn't
seen
we'll
look
at
in
this
notebook,
a
confusion
matrix
which
shows
us
how
often
we
predicted
the
right
labels
along
one
diagonal
and
how
often
we
predicted
the
wrong
labels
along
the
other
diagonal.
A
We
can
also
look
at
the
f1
score
for
this
model,
which
is
very
good,
so
these
notebooks
seem
to
have
reasonably
good
results,
but
notebooks
are
interactive
documents.
They
don't
look
all
that
much
like
software
artifacts
in
a
traditional
setting.
A
data
science
team
would
throw
some
of
these
over
the
wall
to
an
application.
Development
team
houdry
implement
the
feature,
extraction
code
and
model
training
code
and
build
a
production
service,
but
there
are
all
sorts
of
reasons
why
the
app
dev
team
might
not
even
be
able
to
reproduce
the
results
in
a
notebook.
A
Ideally
we'd
be
able
to
streamline
the
process
of
going
to
production,
increase.
The
velocity
of
these
cross-functional
teams
ensure
reproducibility
and
get
some
ongoing
assurance
that
our
code
and
models
are
behaving
once
they're
in
production.
If
we
were
dealing
with
conventional
software,
we'd
use,
C,
ICD
and
other
devups
techniques
to
achieve
this,
and
things
are
no
different
with
machine
learning.
Let's
see
how
to
use
open
shifts,
developer
experience
to
improve
the
efficiency
of
our
machine
learning
team
we're
going
to
set
up
an
open
shift,
build
corresponding
to
our
whole
machine
learning
pipeline.
A
Here
we
have
a
source
to
image
builder.
That
knows
how
to
take
a
git
repo
of
jupiter,
notebooks
and
post-process
and
executes
them
to
make
a
model
service
in
this
case
we're
going
to
specify
our
machine
learning
pipeline
in
terms
of
notebooks.
The
first
is
going
to
be
that
feature
engineering,
notebook
that
goes
from
text
documents
to
vectors,
and
the
second
is
going
to
be
that
model
training
notebook.
A
Let's
see
what
it
looks
like
we'll
interact
with
this
service
from
a
Jupiter
notebook
to
interactively
demonstrate
how
other
services
and
our
application
might
call
out
to
it.
In
this
first
cell,
we're
just
defining
a
very
basic
client
function
for
our
service.
This
function
takes
some
text
and
uses
it
to
make
an
HTTP
POST
to
our
service.
Returning
the
predicted
value,
we
can
see
how
it
works
by
comparing
some
nonsense,
words,
which
we
expect
to
be
spam
with
the
first
few
words
of
Pride
and
Prejudice,
which
we
expect
to
be
legitimate.
A
We
can
use
our
service
to
make
predictions
about
some
of
our
training
data
and
sanity
check
that
it's
performing
adequately.
It
looks
pretty
good.
However,
one
of
the
big
challenges
of
machine
learning
systems
is
concept
drift.
The
nature
of
the
data
we
see
in
the
real
world
can
gradually
drift
away
from
the
nature
of
the
data
we
trained
the
model
on
meaning
that
our
model
no
longer
faithfully
models
reality
put
another
way,
while
conventional
software
often
breaks
in
obvious
ways.
Machine
learning
models
can
break
silently
they'll
continue
giving
you
answers.
A
Those
answers
will
just
be
wrong.
More
often
than
you'd
like
we
can
actually
detect
concept
drift
by
tracking
metrics
about
the
predictions
we've
made.
While
we
don't
know
in
general
whether
our
model
is
making
correct
or
incorrect
predictions,
we
do
know
that
we
expect
roughly
the
same
proportion
of
legitimate
and
spam
messages
over
time.
We
certainly
don't
expect
sudden
drastic
shifts
these
indicate
that
either
the
distribution
of
messages
has
legitimately
changed
or
that
our
models
performance
has
worsened
in
this
dashboard.
A
We're
looking
at
the
predictions
our
model
has
made
over
time,
while
scoring
synthetic
messages
streaming
in
on
a
kafka
topic.
We're
plotting
the
logarithm
of
the
counts
of
each,
which
means
that
the
slope
of
each
line
is
proportional
to
its
rate
of
growth.
Independent
is
independent
of
how
large
the
quantity
is.
If
the
ratio
of
legitimate
messages
to
spam
messages
is
the
same
over
time,
these
two
lines
should
be
roughly
parallel.
A
We've
actually
set
up
our
synthetic
message,
generator
to
start
producing
more
legitimate
messages
over
time,
and
we
can
see
where
the
drift
occurs,
as
the
lines
are
no
longer
parallel,
indicating
that
legitimate
messages
are
growing
at
a
higher
rate
than
spam
messages.
This
sort
of
divergence
would
be
obvious
to
a
data
scientist,
but
we
don't
need
to
tie
data
scientist
up
looking
at
dashboards.
We
can
define
Prometheus,
alerting
rules
for
this
or
even
train
machine
learning
models
to
identify
this
sort
of
drift
in
our
systems.
A
In
this
short
demo,
we've
seen
how
OpenShift
supports
a
data
scientists,
entire
workflow,
from
self-service
provisioning
for
a
self-contained
discovery,
environment
with
storage,
streaming
compute
and
interactive
development
to
model
deployment
and
production
monitoring.
We've
seen
how
the
benefits
of
open
shift
for
contemporary
software
development
teams
also
applied
to
the
teams
who
are
building
machine
learning
systems
and
intelligent
applications.