►
Description
The third meeting of the Arlington VA Community Facilities Study Committee featured Elizabeth Hardy and Andrew D'huyvetter of the Arlington County Dept. of Community Planning, Housing and Development, speaking on County demographics and forecasts. Recorded on March 11 2015. For more information, go to http://commissions.arlingtonva.us/community-facilities-study/.
A
Good
evening,
how's
everyone
doing
thanks
for
having
us
here
tonight,
I
hope
you
haven't
had
too
much
too
many
numbers.
Yet
we
were
just
getting
started
here.
As
Bob
said,
my
name
is
Elizabeth
Hardy
and
my
colleague
here
andrew
de
Vetter,
we're
both
in
playing
Division
I'm,
a
part
of
the
urban
design
and
research
team.
A
Okay,
so
tonight
we're
just
going
to
go
over
some
of
the
current
population,
demographics
and
how
did
we
get
there?
Where
are
we
today?
How
did
we
get
there
and
where
are
we
going
in
Arlington's
housing
supply
and
changes
in
our
housing
supply
emerging
trends
in
our
housing
supply,
then
we're
going
to
get
to
our
forecast.
The
purpose
methodology
accuracy,
our
current
forecasts
and
what
trends
we
continue
to
monitor
so
Arlington
is
a
diverse,
growing,
well
educated
community.
A
It's
of
January
of
this
year
we've
reached
two
hundred,
sixteen
thousand
seven
hundred
people,
a
hundred
and
two
thousand
one
hundred
households,
110
thousand
three
hundred
housing
units
and
Arlington
attracts
people
from
around
the
world.
Our
community
is
made
up
of
people
from
over
100
countries
and
we
continue
to
track
people
at
a
rate
of
about
10
people
per
day
from
around
the
world.
A
So
this
looks
at
the
change
in
total
population
and
housing
units
since
1950
does
anyone
know
what
happened
in
nineteen
forty
in
Arlington
to
big
job
centers
that
came
to
County,
the
Pentagon
and
national
airport?
So,
following
that
the
construction
of
those
facilities,
there
was
a
tremendous
need
for
employees
and
the
housing
for
these
employees,
so
in
the
1950s
and
60s,
and
even
up
to
the
70s
we've
seen
in
a
dramatic
increase
in
our
population.
A
But,
as
you
can
notice
in
this,
the
main
thing
that
stands
out
is
that
population
decline
and
from
70
to
80s.
As
you
can
see,
our
housing
units
still
continue
to
increase
during
this
period,
so
we
didn't
lose
any
housing
units.
So,
what's
going
on
in
late
1960s,
there
were
economic
factors
that
increased
interest
rates.
A
They
also
we
had
significant
inflation,
the
cost
of
land
materials
and
labor.
They
all
went
up
and
they'd
all
made
it
less
desirable
for
investors
to
buy
single-family
homes.
So
where
did
the
investors
put
their
money?
They
turn
to
condos.
This
was
a
desirable
opportunity
for
them
and
desirable
for
homeowners,
because
they
could
buy
a
house
or
a
housing
unit
and
not
have
the
cost
of
a
single
family
unit.
So
in
that
nineteen,
seventy
to
eighty
time
period,
we've
actually
added
about
6,300
condos
and
the
majority
of
these
or
condo
conversions.
A
A
A
A
What's
unique
about
the
1970
1980
time
period
is
that
we
had
a
ship
in
household
type,
so
in
1970
the
majority
of
housing
units
were
family,
our
housing
household
excuse
me:
majority
of
households
were
family
households
and,
as
we
had
that
shift
in
our
housing
unit
structure,
we
shifted
to
the
majority
non-family
households.
So
those
are
people
of
non
living
together
and
then
we
continue
to
have
majority
of
households
that
have
increased
in
Arlington
or
non-family.
A
A
So
you
can
see
that
single
family
housing
had
increases
in
their
average
household
size,
from
2000-2013
for
both
owner
occupied
and
renter
occupied,
the
multifamily
to
the
two
to
four
units
and
the
five
plus
units
really
kind
of
stayed
around
the
same
range
and
even
decreased
a
little
bit
in
some
areas
and
as
Lisa
talked
about
age
really
in
has
a
lot
of
influence
and
housing,
choice
and
and
selection
where
people
move
and
live.
So
when
take
a
moment
to
look
at
age
so
meet.
A
A
A
So
looking
a
little
further
at
age,
this
is
the
breakdown
age
cohort
data
from
2010
census,
so
the
blue
lines
represents
a
2010
census
numbers
and
the
and
the
green
lines
look
at
the
two
thousand
census
levels.
So
there's
three
main
areas
that
have
increased
in
in
size:
the
first,
let's
start
at
the
right.
So
the
first
are
those
aged
55
to
74
and
predominantly
those
62
64
had
has
had
a
sixty
four
percent
increase
over
a
ten-year
period.
A
So
the
question
that
we
were
we
need
to
find
out
is:
will
these
trends
continue?
Are
these
the
age
groups
that
are
going
to
continue
to
grow
at
fastest
pace
in
the
county,
and
one
way
to
look
at
this
information
is
look
at
the
change
in
generations
over
the
past
several
decades,
so
this
shows
when
the
generations
have
peaked
in
the
county,
so
the
gray
line
is
for
those
born
three
1946
of
the
pre
baby
boomers
and
they
peak
sometimes
1980
or
before
that's
off
the
chart.
A
Generation
X
peaked
in
two
thousand
and
they
were
the
age
19
to
35,
and
then,
when
we
come
up
to
the
2010
census,
we
see
that
Millennials
are
in
the
age
range
of
ten
to
twenty
eight,
and
this
leads
us
to
the
question:
have
a
peaked:
are
they
going
to
decline?
What's
the
magic
number
for
Millennials
in
Arlington.
A
A
So
we
look
at
the
breakdown
by
age
cohort,
and
this
is
the
annual
growth
since
2010
2
2013,
there
has
been
one
age
cohort
that
has
consistently
been
above
the
rate
of
the
county's
growth
rate,
and
let
me
just
take
one
step
back.
The
dotted
lines
represent
the
county's
growth
rate
that
for
that,
for
that
one
year
period,
can
anyone
tell
which
age
group
that
is
which
age
group
has
consistently
been
above
the
county
average.
A
A
Now
we're
going
to
keep
breaking
this
down
so
we're
breaking
it
down
to
those
under
the
age
of
five.
And
if
we
look,
though,
those
under
the
age
of
five
continue
to
grow
from
twenty
ten
to
twenty
thirteen
they've
grown
to
about
13,500
residents
to
about
six
percent
of
the
population,
and
they
have
had
a
it's
a
thirteen
percent
growth
rate
since
2010.
A
We
look
at
the
opposite
end
of
the
spectrum.
Those
65
plus
they
also
have
continued,
have
increased
since
2010,
make
up
about
nine
percent
of
the
population
and
2013
and
they've
had
a
twelve
percent
growth
rate
since
2010
those
aged
30
to
39
are
very
important.
This
age
group
represents
forty
percent
of
all
growth
since
2010
and.
A
Another
factor
that
influences
a
population
change
is
migration,
and
this
slide
looks
at
at
movement
patterns
over
one
year.
The
blue
lines
represent
people
who
lived
in
the
same
house
over
one
year
period.
The
green
bars
represent
those
who
have
moved
but
have
stayed
in
Arlington.
So
if
we
look
at
the
lowest
ones,
that
means
those
are
the
people
that
are
the
most
mobile.
A
So
those
are
people
who
are
18
to
about
34,
but
even
though
they
are
most
mobile
of
the
people
moving
in
those
ago
in
that
age
cohort
they
have
the
highest
rate
of
people
of
more
people
moving
to
Arlington
than
from
so
this
chart
looks
at
the
population
coming
to
Arlington
in
the
green
and
the
population
moving
from
Arlington
in
the
red
and
if
we
add
those
up
or
combine
them,
the
blue
line
is
the
net.
It
shows
if
we
have
a
positive
increase
from
the
population,
so
you
can
see.
A
So
the
question
is:
will
they
go
or
will
they
stay
and
that's
why
we're
continuing
to
monitor
some
factors?
We're
continue
to
monitor
the
Millennials.
What
are
they
doing
as
a
population
age
cohort
increasing
decreasing,
stating
the
same?
What
are
the
Generation
X
doing?
We
also
want
to
Train
verse
for
Arlington
residents
by
age
of
the
mother,
and
then
we
also
monitoring
our
housing
supply
and
desiring
Tanev.
The
right
house
he
mix
for
the
growing
populations,
so
andrew
is
going
to
start
talking
about
the
housing
supply.
B
Thank
You
Elizabeth,
my
name
is
Andrew
davetta
and
I'm
Elizabeth's
colleague
in
the
urban
design
and
research
section
and
I'm
going
to
go
over
Arlington's
housing
supply
talk
about
some
of
the
current
trends
we've
seen
in
the
last
14
years
and
then
go
over
our
forecasting
process.
So
this
is
a
pie
chart
of
our
January
1
2015
estimate
of
the
number
of
housing
units
in
arlington
county
by
type,
and
we
show
this
broken
out
into
three
categories
that
we'll
use
consistently
throughout
the
rest
of
the
presentation.
B
So
in
blue
we
have
single-family
detached
homes,
so
these
are
homes
that
don't
touch
any
other
homes.
They
don't
share
a
wall
single-family
attached
in
green.
You
can
think
of
as
share
homes
that
have
a
party
wall,
so
townhouses
duplexes,
semi-attached
units
etc,
and
the
orange
is
three
nin
surplus
multifamily
and
that
can
include
garden
style,
condo,
elevator,
etc,
and
so
what's
important
here
is
that
by
the
numbers,
Arlington
is
a
multi-family
County.
B
Almost
two-thirds
of
Arlington's
housing
supply
is
multifamily
and,
while
single-family
detached
is
most
of
the
land
area
of
housing,
it's
only
twenty-six
percent
of
the
housing
stock
and
over
the
last
five
years,
our
housing
supply.
You
can
see
the
numbers
on
the
right.
Most
of
that
growth
is
in
multifamily.
B
We
show
growth
between
1950
and
2010,
and
remember
Elizabeth
showed
that
population
loss
between
1970
1980,
we
did
have
units
go
online
as
she
mentioned,
but
most
of
those
units
were
multifamily.
You
can
see
on
the
stacked
bar
chart.
The
multifamily
in
Greg
keeps
growing
to
that
point
where
we
were
at
with
almost
two-thirds
of
the
housing
supply
being
multi-family.
B
B
These
next
series
of
slides
is
going
to
show
development
activity
by
those
three
housing
types
of
a
sense
2000.
So
this
is
looking
at
single-family
detached
homes
in
the
blue
is
showing
the
new
construction.
So
on
average,
every
year
we
put
131
single-family
homes
online
in
Arlington
and
on
average
every
year
we
demolish
103.
So
this
is
essentially
an
indicator
of
tear
downs
is
what
you're,
looking
at
very
few
single-family
homes
come
online
on
vacant
land
not
linked
in
there.
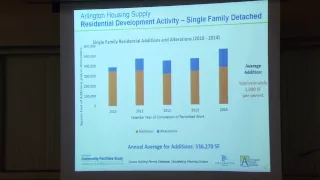
B
This
is
looking
at
additions
and
renovations
data.
So
looking
over
the
last
five
years
and
the
blue
is
alteration
so
that
was
permitted
activity
on
single-family
homes
that
were
where
the
space
already
existed
and
was
being
renovated
and
the
orange
is
showing
the
new
space
the
addition,
so
it's
totally
new
space
and
on
average
in
Arlington
it's
about
300,000
square
feet
of
residential
single-family
home
residential
space
is
being
added.
So
you
can
think
of
that.
300,000
is
like
a
very,
very
large.
B
Multi-Family
residential
building
is
coming
online
in
our
single-family
neighborhoods
purely
through
additions
every
year,
and
that
does
not
count.
Tear
downs
because
tear
downs
typically
are
larger.
The
new
units
are
larger
than
what
was
demolished.
So
this
is
a
significant
indicator
of
change
in
our
single-family
neighborhoods.
B
This
image
looks
at
other
single-family
attached.
You
know,
there's
not
a
lot
of
land
intended
for
this
type
of
unit,
but
we
do
it
does
come
online
and
in
significant
volumes
in
different
years
and
on
average
we
net
about
47
units
per
year,
so
higher
than
single-family
homes,
and
then
most
of
our
growth
is
in
multifamily.
So
you
can
see
we
had
significant
development
activity
in
2006
and
2007
pre-recession
it
tapered
off
and
then
came
back
in
2011,
and
this
is
looking
at
completions.
B
So
it
takes
a
few
years
once
a
project
gets
its
financing
and
goes
under
construction
to
come
online,
so
you're
seeing
a
bit
of
a
lag,
but
it
is
certainly
back.
We
see
all
of
the
residential
cranes
in
the
air,
so
we
do
tear
some
down.
We
put
a
lot
up
in
on
on
average,
we
net
1181
multifamily
units
per
year,
and
so
that's
where
most
of
our
growth
has
been
since
2000.
B
Very
little
vacant
land
remains
in
Arlington,
as
I
mentioned,
so
development
is
really
redevelopment.
Some
other
takeaways
here
from
this
set
of
slides
are
that
the
net
growth
and
those
single-family
homes
is
not
significant.
It's
only
20
per
year,
there's
a
lot
of
change
happening
in
the
single-family,
neighborhoods
and
I.
Think
we're
also
seeing
that
reflected
in
the
student
population
and
multi-family
housing
that
1,100
units
net
new
represents
about
ninety-four
percent
of
our
annual
net.
B
B
B
So
why
do
we
do
this?
Well,
we
do
it
because
we're
required
to
so
we
do
it
in
coordination
with
the
Metropolitan
Washington
Council
of
Governments
they're,
the
regional
NPO.
We
call
them
cog
and
we're
required
to
by
the
Clean
Air
Act,
essentially,
is
how
it
boils
down,
and
the
primary
purpose
is
that
these
are
the
land-use
inputs
that
go
into
a
regional
transportation
model
and
that
regional
transportation
model
determines
whether
or
not
we
are
in
conformity
for
air
quality
purposes,
and
some
of
those
purposes
are
federal
transportation
funding.
B
So
we
do
it
for
air
quality.
There's
a
couple
requirements
that
cog
puts
forward,
and
one
is
that
the
forecast
must
be
consistent
with
a
jurisdictions,
comprehensive
plan.
In
this
case,
that
really
means
the
general
Land
Use
Plan
and
the
constrained
long-range
transportation
plan,
which
you
can
just
think
of
as
it's
a
list
of
transportation
projects
that
are,
we
generally
update
this
annually
and
generally
the
process
is
voluntary.
B
So
how
do
we
use
this
forecast?
We
use
it
in
all
sorts
of
communications
vehicles,
it's
used
by
schools,
we
use
it
in
the
budget
and
CIP
process.
We
use
it
to
plan
our
future
needs
and
we
also
use
it
for
research
in
the
planning
division.
Looking
at
the
impacts
of
land-use
change,
primarily
in
transportation
planning
and
an
economic
impact
analysis.
B
So
how
do
we
do
it?
There's
three
main
steps.
First,
we
generate
the
land-use
inputs
for
the
forecast,
so
those
buildings
that
are
consistent
with
the
general
Land
Use
Plan.
We
apply
assumptions
to
those
buildings
and
then
once
we
have
those
outputs,
we
look
at
the
timing
and
we
calibrate
it
so,
starting
with
land
use
inputs.
One
of
the
first
inputs
is
our
development
pipeline
data.
B
So
we
track
development
in
Arlington
County,
and
that
comes
from
our
permitting
information
and
becomes
from
plans
approved
by
the
County
Board
site
plans,
form
based
code,
etc,
and
we
know
those
projects
where
they
are
and
we
include
in
the
forecast
those
projects
that
were
completed
under
construction
or
approved
and
for
this
forecast
around
the
cutoff
date.
For
that
was
last
summer.
It
was
june
30
2014,
and
this
is
really
the
the
basis
of
our
early
years
in
the
forecast
25th
15
to
20
25.
This.
B
Where
were
we
where
we
forecast
growth,
and
so
this
image
on
the
right
is
a
snapshot
of
the
general
Land,
Use
Plan
and
the
light
yellow,
that's
a
single
for
low
density,
residential,
so
primarily
single-family
and
that's
meant
not
to
change,
and
then
some
of
the
black
lines
and
sort
of
the
darker
more
intense
colors.
That
represents
higher
density,
more
mixed-use
and
a
lot
of
them
represent
our
plans
or
sector
plans,
are
small
area
plans
and
that
that
is
guidance
that
forms
the
bay
of
our
forecasting
effort.
B
So
the
red
shows
our
metro
corridors,
the
metro
station
areas
and
then
the
blue
shows
those
other
plans
and
those
include
east
falls.
Church
cherrydale
knock
shirlington
in
the
to
form
based
code
areas
along
columbia,
pike
and
so
in
in
these
areas
we
look
towards
the
plans
in
the
general
Land
Use
Plan
guidance
to
determine
the
density
in
the
form
that
future
development
could
take,
and
we
make
sure
that
they're
consistent.
We
also
look
to
the
zoning
and
there's
important
distinction
here.
The
general
Land
Use
Plan
is
our
future
vision
for
land
use
in
Arlington.
B
The
zoning
is
our
existing
legal
framework
on
a
piece
of
property,
and
typically
the
zoning
is
much
lower
than
what
the
future
vision
is.
So
we
look
at
both,
but
really
it's
all
about
the
general
land
use
plan
in
our
forecasting
process,
and
this
forms
that
the
outer
years,
where
you
know
nothing,
is
permitted
or
approved
by
the
board,
but
it
could
be
so
next
once
we've
assembled
those
buildings
in
that
development.
We
apply
demographic
assumptions
to
it
and
there's
primarily
two
ways
that
we
do.
This
one
is
with
housing
units.
B
So
we
take
those
land
use
inputs.
We
get
housing
units
and
we
apply
occupancy
rates
from
the
census.
To
get
household
so
and
occupied
housing
unit
is
a
household.
Then
we
look
at
those
households
and
look
at
their
apply.
Their
average
household
size
rates
and
that
determines
population,
and
we
do
vary
these
rates
by
small
geographies
because
they
vary
significantly
throughout
the
county.
B
So
when
we
time
it,
we
do
look
at
an
individual
site
level
and
that
some
of
those
factors
that
we
look
at
include
the
redevelopment
potential
of
the
site.
The
parcel
configurations
you
know
are
they
is
it
one
parcel?
Is
it
a
bunch
of
very
strange
parcels?
What's
the
ownership?
Is
it
one
owners
of
multiple
owners
and
what
is
the
level
of
developer
interest
in
door
staff
knowledge
that
revolves
around
that
site?
B
So
we
look
towards
that,
but
we
also
adjust
the
timing
in
our
forecasting
process
based
on
historic
trends
for
both
residential
and
commercial
office
construction
rates.
So
we
look
towards
past
performance
to
help
indicate
future
performance,
and
much
of
that
is
informed
by
five
year
averages
of
net
new
multifamily
units
and
those
earlier
slides.
That's
the
information
that
forms
those
five
year
averages.
So
we
look
towards
the
recent
past
to
inform
the
future.
B
So
what
are
some
of
the
results
for
population
between
twenty
ten
and
twenty
forty?
We
show
continued
growth
and
the
net
changes
about
75,000
people
deployment
looks
a
little
different.
We
show
growth
between
twenty
ten
and
twenty
forty
of
about
seventy
nine
thousand
jobs,
but
we
do
show
a
decline
between
2010
and
2015
to
reflect.
The
economic
conditions
were
seeing,
and
most
of
this
was
due
to
base
realignment
enclosure
brac,
as
well
as
the
impacts
of
the
sequester
on
the
office
market
for
units.
B
B
Once
we
had
more
information
about
economic
conditions,
we
were
pretty
close,
so
this
last
slide
is
a
highlight
of
some
of
the
trends
that
we're
monitoring
on
the
Left.
We're
looking
at
indicators
in
our
forecasting
process,
see
there's
things
we
either
have
looked
at.
Do
currently
look
at
or
intend
to
look
at
in
the
future,
and
that's
always
looking
at
our
office
writes
our
office
vacancy
rates.
What
are
some
of
the
GSA
leasing
trends?
These
are
changing
rapidly.
Gsa
is
putting
more
people
in
less
space.
So
how
consistent
is
that
trend
in
the
future?
B
And
how
does
that
impact
on
employment
space
factors?
You
know?
Is
this
a
blip,
or
is
this
a
30-year
trend?
That's
putting
more
people
in
less
space,
it's
hard
to
tell
right
now,
but
it's
something
we're
paying
attention
to
what
what
is
the
county's
policy
and
guidance
towards
temporary
building
reuse?
We
could
make
assumptions
for
it
in
the
forecast.
What
are
our
absorption
rate
trends
and
then
we
do
look
at
our
average
household
sizes
to
see
if
they've
been
changing
and
at
least
right
now
with
American
Community
Survey
data.
B
We're
not
seeing
a
significant
change
in
the
county
in
terms
of
average
household
size
and
then
one
place
we
could
look
in
the
future
is
the
capacity
of
single-family
neighborhoods,
although
we're
only
showing
that
net
28
new
units
per
year
and
then
all
of
these
residential
classe
apartments
that
are
coming
online,
you
know
what
are
their
vacancy
rates,
their
rents
in
their
absorption
on
the
right.
We
show
potential
collaboration
with
APs,
and
these
are
areas
where
we
intend
to
work
with
ApS
to
further
understand
how
those
single-family,
neighborhoods
and
multifamily
neighborhoods
are
changing.
B
We
know
there's
a
lot
of
change
happening,
I
mean
what
the
impacts
of
these
changes
are
on
the
county
and
the
student
population,
and
so
I
have
them
split
between
single
and
multi-family.
But
it's
you
know:
monitoring
household
sizes
and
student
generation
rates
trying
to
understand
that
single
family
change
in
looking
at
indicators
that
we
can
use
over
the
long
term
to
help
us
better
track
it,
and
with
that
I
will
hand
this
over
Oh
turn
it
over
to
John.