►
From YouTube: Analog Workgroup Meeting April 18 2023
Description
Presentation by Dr. Sadayuki Yoshitomi on the spice model development ecosystem
A
So
today
we
invited
Dr
sadayuki
Tomi
and
his
talk
is
going
to
be
about
the
recent
updates
on
automated
spice
model
development
ecosystem
for
from
an
industry
perspective
has
a
lot
of
experience
in
modeling
and
he's
currently
working
for
Mega
chip
Corporation,
where
he
works
as
a
chief
Specialist
of
of
optical
communication,
IC
products
and
Technical
marketing
for
6G
Technologies.
He
has
a
a
lot
of
experience
with
by
CMOS
and
3D
nand
flash
memory
products
as
a
team
manager
at
I
think
Toshiba
and
I'll
I'll.
B
B
B
B
So,
as
shown
in
this
illustrations,
are
G
being
the
target
specification
tags
descriptions
this
this
part
at
the
worst.
Corner
condition
is
a
requirement
for
the
tablet,
and
this
silicon
performance
is
a
lead
performance
after
after
in
the
product
of
production
phase
so
and
between
this
blue
blue
line
and
red
line.
So
we
call
it
it's
a
it's
a
design
margin,
and
this
is
a
designer's
pain,
honestly
saying
and
if
it,
if
we
have
a
look
at
them,
what
kind
of
contents
are
included
in
margin,
so
margin
included
in
accuracy?
B
So
in
that
case
the
designers
will
face
much
more
amazing
for
in
the
for
the
previous
models
and
if
you
continue
this
kind
of
this
kind
of
user,
a
typical
approach
to
have
more
margin
between
generation
and
generation.
So
in
the
in
the
in
the
end
it
it
may
not
even
be
possible
to
achieve
the
target
specifications
at
the
schematic
design
stage.
B
B
As
you
know,
designers
are
looking
at
the
mass
production
stage,
but
here
this
this
is
a
designer's
perspective,
but
our
pdk
team
is
looking
at
a
silicon
at
a
given
snapshot
like
here.
We
we
model,
we
produce
a
model
of
the
Silicon
wareha
at
a
given
time
slot,
but-
and
we
add
the
long-term
property
prediction
into
the
spice
model
library
at
the
the
final
stage
of
the
pdk
development.
B
But
after
the
completion
we
usually
don't
verify
the
accuracy
during
the
mass
production
phase,
we
don't
vptk
team,
don't
take
care
about.
What's
going
on
in
the
production
phase.
This
is
a
our
you
know,
scheme
issue
scheme
problems
to
be
develop
and
brush
up
to
the
pdk.
Therefore,
If
the
product
characteristics
deviate
from
the
prediction
by
the
Target
design
teams.
Designers
always
claim
pdk
team
that
saying
that
the
inaccuracy
spice
model
cause.
B
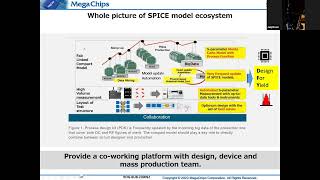
So
this
is
right
shows
a
whole
picture
of
big
spice
model
development
ecosystem,
which
we
have
built
in
my
actually
in
my
previous
work.
So
this
system
enables
continuous
monitoring
of
silicon
silicon
characteristic
characteristics
as
it
changed
from
early
development
stage
to
mass
production
stage.
B
So,
as
you
know,
the
in
the
beginning
of
the
development
stage,
the
Silicon
characteristic
changes
from
time
to
time
from
lot
to
rot
and
at
the
end
of
the
mass
production
stage.
This
is
a
stage
that
silicon
performance
stabilizes,
but
in
our
pdk
development
scheme.
So
we
mainly,
we
usually
receive
the
warehouse
in
the
number
process,
lump
up
stage
and
create
a
model.
B
B
First
key
issue
is
that
to
track
as
the
Silicon
performance
as
a
form
of
spice
models
are
just
frequently
as
possible.
This
is
a
this.
A
fast
tracking
system
represents
this
iteration
Circle
in
this.
In
this
part,
in
this
figure
and
in
addition
to
the
conventional
DC
characteristics,
as
is,
you
know,
always
run
by
the
user,
basic
Foundry
so
in
this
system
can
also
monitor
the
high
frequency
characteristics
associated
with
s
parameters,
as
shown
in
the
Indescribable
GSD
testoster
structure.
B
In
this
picture-
and
this
is
a
second
key
issue
of
the
layout
of
this
structure-
for
the
dedicated
experimental
measurement
and
also
the
third
exponent
key-
is
high
volume
measurement
and,
in
addition,
I'd
like
to
say
that
the
traveling
compact
model,
which
will
be
explained
in
a
in
this
in
my
presentation
later,
which
provides
a
Six
Sigma
design
environment
that
can
be
used
to
establish
a
breach
of
factory
and
design
team.
This,
for
these
four
key
issues,
are
important
components
of
the
spice
modeling
ecosystem.
B
So
this
is
a
this.
Is
a
this
block?
Stand
for
the
you
know:
extraction,
steps
and
Blue
Line
Stands
for
the
name
of
the
commercial
editors
which
I
can
say
the
commercial
commercially
based
idiot
tools,
but
we
need
a
customization
in
order
to
fit
our
workflow,
so
we
use
it
in
order
to
fit
our
this
line
of
two
boxes.
Bunches
of
tools
into
our
workflow.
We
use
the
python
code
to
customize
an
environment
that
fit
the
data
transformation
between
two
Eda
tools
and
the
computational
works.
We
need
to
do.
B
A
B
Part:
okay,
okay,
so
this
spice
model
automation
flows
starts
from
the
auto
measurement
scheme.
This
represents
this
here,
Autumn,
which
say
in
this
right:
it's
I
I
locked
down
as
Auto
measurement
scheme
scheme.
This
is
all
this
measurement
scheme
is
already
automated.
I
can
explain
you
in
my
followings
right
and
we
correct
the
data
set
by
the
auto
measurement
setup
and
we
best
by
using
this
data
set.
We
we
run
the
measurement
QSC
program
to
automatically
a
QA
the
measurement
data.
B
What
kind
of
TV
criteria
we
used
in
the
measurement
QA
procedure
is
the
if
we
find
if
we
find
the
cons
data
consistency
with
the
same
bias,
condition
for
with
the
same
bias,
condition
with
different
kinds
of
set
of
measurements.
This
is
also
automatically
done
by
automatic
automation,
Pro,
but
the
the
modding
scheme,
all
right,
Andrew.
If
you
take
a
look
at
the
modeling
scheme,
the
golden
die
selection
is
automatic
automated
in
a
workflow
but
modern
parameter
extractions,
such
as
core
model
and
macro
model.
We
need.
We
have
some
kind
of
little
bit
iteration
process.
A
B
B
So
most
of
the
most
of
the
audience
in
this
in
this
works,
you
know,
working
group
meeting
are
familiar
to
the
DC
test
structure,
roughly
for
low
frequency,
low
frequency,
characterization,
so
I'm,
I'm,
literally
I'm.
In
my
presentation,
I
I
addressed
the
RFD
structure
needed
that
I
used.
We
used
for
the
Spice
modeling
Earth
system,
but
this
is
an
additional
part
of
the
test
structure.
B
I
have
to
mention
it,
so
this
is
an
example
of
a
designing
of
operation
pattern
to
register
the
experiment
in
Big
Data,
big
data
set
So
based
on
the
usual
GSG
pattern.
This
is
a
usual
GSD
pattern
as
as
approximation
size
is
like
two
300
micro,
micrometers
micrometers
in
north
north
to
south
and
east
to
west
side.
This
is
a
usual
conventional
test
pattern,
but
this
conventional
GST
pattern
is
not
not
good
at
fitting
The
Scribe
line
area.
B
B
But
the
value
this
to
design
to
to
design
the
school
line,
type
GSG
pattern.
There
is
a
lot
of
design
design
issues
in
order
to
have
this
performance
compatibility
with
conventional
GSD
GSG
patterns.
So
there
is
a
difficulties
to
difficulties
in
three
parts:
yeah
to
this
to
design
The
Scribe
line
type
GSG.
B
The
first
one
is
the
first
most
of
the
difficult
part
to
realize
described
by
GST.
Pattern
is
a
location
of
signal
signal
path.
So
a
signal
path
is
here
and
here
and
to
to
establish
a
rooting
line
from
this
signal
part
to
the
device
Edge.
So
we
have
to
establish.
We
have
to
load
the
very
long
trackling
from
here
to
the
edge
of
edge
of
the
device
and
furthermore,
we
have
to
here.
B
This
is
Grand
Reigns,
very
close
to
the
signal
line,
so
we
have
to
take
account
that
this
stands
from
ground
distance
from
ground
and,
furthermore,
the
because
this
knows
to
South
distance
is
really
very
tiny.
So
we
have
to
think
we
have
to
optimize
the
ways
of
signal
line
in
order
to
reduce
the
parasitic
series
resistance
impedances.
B
But
this
is
not
an
easy
task
so
to
optimize
this
guy,
this
kind
of
layout,
so
we
use
the
the
electromagnetic
simulations
after
to
optimize
the
this
pattern
in
order
to
have
as
much
compatibility
result
as
convention
conventional
GSE
patterns.
So
this
is
a
result
between
conventional
GSE
test
structure
and
describing
type
GST
test
structure.
Still
there
are
discipline
in
consciences
after
20
gigahertz
Legend,
so
there
is
a
room
to
improve
the
this
quality
of
these
two
patterns
in
order
for
the
first.
B
A
parametrics
is
represented
by
addut,
so
to
obtain
each
Matrix
seats
after
the
measurement,
we
multiply
the
inverse
metallic
matrices
matrices
of
the
to
the
addut
in
order
to
obtain
the
air
matrices
of
a
mosfet.
This
is
the
a
parameter
what
we
want
and
from
the
from
the
a
parameter
to
from
M
parameter.
We
transformed
into
asthmatolysis
or
either
a
ea
to
Y
material
seeds
that
we
want
to
model.
We
want
to
use
for
the
modeling
this
feature
of
this.
This
four
four
patterns
has
a
good
good
good
feature
to
fit
our
development
flow.
B
Because
by
using
this
test
structure,
we
don't
consume
a
silicon
area
so
much
as
compared
to
the
typical
tra
redeemed
in
pattern,
which
require
requires
a
lot
of
a
lot
of
silicon
area
for
to
establish
the
embedding
pattern
on
chip,
okay
and
from
from
Tuesday
from
here.
This
is
it's
a
bit
of
a
beaten
pass,
but
here
is
the
example
of
the
GS
GST
Evolution
pattern:
design
needed
to
calibrate
the
plastic
extraction.
B
Engine
such
as
the
EM
simulator
and
the
PEX,
so
creating
the
environment
for
plastic
extraction
requires
comparing
the
actual
test
pattern
measurement
of
the
electric
permittivity
and
where
resistance
and
interconnected
real
resistance
and
Fringe
capacitances
these
four.
These
four
matrices
are
Target
to
to
calibrate
to
a
Target
Target
to
calibrate
the
em
electromatic
em
simulation
engine
or
text
extraction.
Engine.
B
And
this
table
is
approved
to
type
patterns
used,
are
used
as
a
to
develop
the
you
know,
em
setup
or
pick
setup
setup
the
pattern
for
everything
the
pattern
for
a
variating
relative
permittivity.
This
is
stands
for
here
in
this
in
this
table.
It
is
a
desired
group
to
place
a
gathering
here
to
accurately
estimate
the
substrate
resistance.
B
B
These
equations
that
transforms
to
each
plastic
parameter
extractions,
such
as
Cox.
It's
a
you
know:
public
capacitance,
the
substrate.
This
is
represented
in
this
in
this
figure
also
and
substrate
impedances
G,
sub
G
sub
is
a
parallel
combination
of
R,
sound
machine
Subs.
This
plastic
impedances
in
the
Silicon
substrate.
B
Okay
and
if
we
have
a
look
at
the
free
Fringe,
capacitance
extraction,
I
I
used
for
two
two
kind
of
Moon
cap
test
structure
to
to
calibrate
the
a
plastic
extraction
engine.
So
if
we
have
a
look
at
The,
Fringe
capacitance
extraction
pattern,
so
you
can
see
the
close-up
of
the
of
the
pattern
here.
Two
kind
of
pattern
is
Illustrated
in
this.
In
this
table,.
B
B
We
can
change,
see
the
differences
of
of
printing
capacitance
between
first
metal
and
this
metal
in
red,
so
to
to
verify
the
quantity,
quantitative
numbers
or
Paras
Fringe
capacitances
I
drag
the
proposed
the
number
of
combinations
of
metal
layers
and
the
number
of
ways
of
lower
metal,
which
I
say
in
this
in
this
table
are
red
red
line,
data
dead
metals,
at
least
two
conditions
good
to
obtain
the
love
numbers
and
three
conditions.
Actually
different
weights
is
very
good
to
have
a
more
accurate
num
extraction
of
The
Fringe
capacitances.
B
It
depends
on
the
required
requirement
how
how
many
numbers
are
it's
a
discussion
of
the
Silicon
area,
constant?
The
number
of
variations-
and
it's
also
good
to
have
a
different
length
patterns
with
similar
operations.
Minimum
two
different
kind
of
ranks
Variations
by
using
based
on
this
pattern,
is
preferable.
B
And
third,
one
is
fringe
capacitance,
such
as,
via
capacitance
extraction,
the
same
country.
The
configuration
is
the
same
using
the
moment,
cap
structures,
and
the
only
difference
is
that
the
two
meta
two
metal
layers
are
stuck
in
a
normal
cap
structure
and
we
prepare
the
two
kind,
two
one
set
of
mom
cap
structures,
which
they
are
connected
and
without
beer
connected.
So
two
subtract:
the
capacitance
capacitances
between
two
testosterone,
two
variations,
so
we
can
obtain
the
beer
to
be
a
capacitances
at
the
end
of
the
day.
B
B
So
now
I
move
on
the
mass
muscular
Mass
measurement,
Hardware
I'm,
talking
about
how
to
pair
advancement
so
the
pop-up.
This
is
a
list
of
measurement
instruments
are
used
in
in
my
previous
work
and
I
have
to
say
that
the
performance
of
the
network,
analysis
of
the
recent
model
has
been
improved
remarkably.
A
B
B
Okay,
I
go
back
to
the
list
of
measurement
instruments,
so
I
have
to
say
that
the
network
analysis,
Advanced
advancement,
is
really
very
remarkable
and
once
I
succeeded
calibrations
this
kind
of
most
of
the
update
up
to
date,
Network
are
working.
Our
analysis
is
really
stable
for
between
two
and
three
days
without
any
calibration,
and
this
helps
us
greatly
extending
the
time
for
continuous
or
measurement
measurement
work,
and
also
the
performance
of
the
same
old
Global
has
also
improved,
in
particular,
improved
image.
Recognition
technology
has
drastically
improved.
B
B
So
again,
this
is
a
test
pattern
which
I
shown
in
the
previous
slide
so
to
obtain
the
a
one-half
part
operation
pattern
which
already
shown
in
page
nine,
it
was
used
for
the
evaluation.
This
is
the
two
probe
this.
This
pattern
is
really
challenging
even
manually
but
I.
But
this
is
a
you
know.
Statistical
deviation
of
exponometer,
which
was
obtained
to
100
chips
on
the
300
millimeter
die
on
the
frequency
measurement.
Frequency
was
swept
from
one
gigahertz
to
60,
60,
gigahertz
and
but
study.
B
If
we
have
a
look
at
the
standard
deviation
of
race,
1
1,
the
value
number
is
0.13
DB,
it's
quite
a
good.
It's
a
really
good
numbers
by
using
this
category,
three
challenging
test
pattern
for
the
auto
measurement
for
60
gigahertz-
and
this
is
a
rough
estimation
with
time
time.
Duration
for
needed
for
this
set
of
one.
This
measurement
it's
less
than
10
minutes,
but
it's
only
a
few
minutes
to
complete
this
measure.
B
B
We
need
only
four
minutes
per
device.
This
is
if
we
thanks
to
the
advancement
of
network
analyzer,
so
experimental
measurement
takes
only
few
minutes
to
complete
this
kind
of
measurement
set
of
measurement.
So
this
includes
the
49
bias
conditions
and
110
frequency
frequency
point.
This
is
quite
a
quite
effective
to
collect
as
many
numbers
of
transistor
data
on
the
hardware
300
300
millimeter
Warehouse,
that's
possible.
It's
cool,
pretty
much
pretty
good.
A
B
Yeah
pretty
large,
yes,
okay
and
I
have
to
add
some
other
informations
here.
I
look
down
here,
conventional
GSG.
We
can.
We
can
change
between
100
Micron
to
200
Micron.
If
we
follow
this
configuration
user
complications
and
if
we
follow
this
scribe
line
type
GSG,
we
have
to
pay
attention
to
the
how
to
call
it
a
mechanic
shape
of
the
GST
block.
B
So
there
is
an
interference,
because
this
test
probe
has
a
you
know
a
insulating
rare
like
like
this
like
here
and
here,
and
if
we,
if
we,
if
we,
if
we
reduce
this
number
down
to
160
microns,
it
is
not
possible
to
press
the
GSD
probe
in
this
is
to
waste
the
directions.
So
this
is
from
my
experience
to
keep
160
Micron
is
a
safe,
safe
numbers.
A
A
A
B
Oh
generally
speaking
yeah,
you
are
right,
you
you
can,
we
can
reduce
the
these
size
and
only
to
be
honest,
to
be
honest,
I
wrote
down
the
numbers,
many
of
the,
for
example
the
speech.
So
we
can.
We
can
relate
this
and
now
pitch
pitch
size
down
to
50,
microns
and
the
part
size
also
can
reduce
to
40
microns
sure
so
yeah.
A
A
B
Is
what
I
was
asking
I
see
I
see,
but
so
if
we
increase
the
density
of
a
part,
there
is
one
major
Dropbox
in
order
to
collectorize
the
you
know
very
high
frequency,
very
high
frequency,
you
know
experimenters,
so
we
have.
We
got
it
yeah.
There
is
a
interaction
between
this
part
and
if
you
have
a,
if
you
have
a
part
of
the
neighbors
here,
which
is
very
close
to
this,
you
know
transistor.
We
want
to
measure.
So
there
is
an
interaction
of
a
field
field.
B
Coupling
is
generated
from
the
floor,
even
though,
if
you,
if
you
imagine,
try
to
measure
this
this
transistor
but
there's
a
leakage
of
electromagnetic
waves
to
the
patterns
which
are
connected
to
the
neighbors
and
this
yeah.
This
makes
a
you
know,
measurement
accuracy
a
little
bit.
You
know,
untrustable
I
see
yeah,
so
we
have
to
to
design
to
design.
B
This
kind
of
you
know
test
GSD,
test
structure
for
300
gigahertz
modeling,
calculatorizations
I
joined
the
i33
p28
to
the
working
sub
working
group
to
standardize
the
RF
test
structure
for
silicon
measurement,
so
I
think
in
the
few
monthses.
So
you
will
get
this
standardized
document
at
hand,
foreign.
B
Our
pdk
is
in
my
XX
work
in
possible
referred
that
the
three
enhancements
shown
in
this
table
were
considered
were
necessary,
so
designers
use
design
of
experiment
to
identify
the
primary
component.
This
is
an
image
of
doe
design
of
explained
simulation
result
in
in
this
table
data
significant
to
the
Target
index,
and
if
we
run
the
doe
analysis,
this
helps
a
designer
to
communicate
the
result
directly
to
the
device
team.
This
is
a
con
concept
of
how
of
the
fabric
Model,
which
our
we
want
to
develop
in
our
development
scheme.
B
If
we
find
the
result
by
way
of
a
pilot
chart,
we
can
get
the
information
of
the
process
variables
directly
from
the
spice
simulations
and
there's.
The
processing
team,
which
kind
of
factor
which
kind
of
factor
of
stored
in
the
big
database
should
be,
should
be
much
more.
You
know
finer
control
in
the
process
in
the
fabrication
process.
B
B
Okay,
so
here
is
just
a
summary
of
the
spice
model
of
mosfet
validated
to
110
gigahertz.
So
this
main
part
is
vision
for
model
which
is
already
familiar
to
everybody,
and
this
is
a
based
on
that
we
create,
we
usually
create
the
macro
model
configuration
which
can
fit
have
a
good
fit
with
very
high
frequency,
datas.
B
B
The
model
frame
is
very
good
in
and
which
is
valid
to
110
gigahertz
so,
and
here
I'd
like
to
explain
the
big
data
in
the
X
system,
so
big
data
in
the
in
our
in
the
X's
ecosystem,
which
we
developed
is
consists
of
two
types
of
data
set.
First,
one
is
widely
used
a
wider
code
as
an
inline
data
here
and
second,
is
also
additional
data
set
containing
experimented
data,
which
are
already
explained
in
in
the
presentation.
B
The
use
of
a
scribe
line.
Gsg
pattern
provide
us
with
many
variable
information
that
helps
us
to
explore
the
reality
of
statistical
variation
of
the
transistors,
because
this
pattern
is
a
is
almost
the
same
as
a
transist
same
size
of
the
transistors
in
the
circuit,
which
means
that
to
collect
the
information
from
this
text
structure,
we
can
explore
the
source
of
variation
of
the
real
structure
real
size
of
transistor
and
which
also,
which
gives
a
very,
very
good
information,
more
better
information,
rather
than
the
inline
data.
B
And
this
figure
shows
addition
how
vision
for
parameters
can
be
mapped
to
the
items
towards
in
the
big
data
set
parameters
such
as
tox
and
RD
SW
source
during
shift
resistance
and
XJ
Junction
divs
that
represent
the
physical
structures.
Mosfet
can
be
directly
marked
to
the
medium
and
the
sigma
of
the
big
data
set.
It's
no
problem.
On
the
other
hand,
there
are
some
big
data
items
that
are
correlated
with
many
vision
for
model
parameters
such
as
standard
doping.
Complex
concentrations
explain
represented
by
any
depth
in
a
busy
model
parameters.
B
So
in
the
next
page
we
will
show
how
to
incorporate
this
kind
of
parameters,
which
are
a
lot
of
more
correlations
with
multiple
parameters
by
using
the
in-depth
case.
Actually,
endodep
has
a
lot
of
correlations,
with
many
vision
for
model
parameters
and
such
as
a
Mobility
and
Junction
capacitances.
So
I'll
explain
how
we
treat
this
kind
of
problem,
inline
data
parameters
into
spice
models,
so
we
want
to
if
we,
okay,
let's,
let's
focus
on
the
mobility,
how
Mobility,
how
to
map
and
depth
inline
data
for
Mobility
functions
we
want
to.
B
B
This
experience
is
here
and
then
the
flux
fluctuation
of
Mobility
is
determined
as
a
ratio
of
discount
function.
If
you
represented
by
f,
u
e
n,
dep
bracket
and
depth
and
the
NDP
is
a
you
know:
numbers
which
fluctuated
and
anode
zero
is
a
nominal
divided,
so
to
really
place
the
model.
Each
model
parameters
to
other
Envision
model
of
model
card
as
to
implement
this
kind
of
a
term
of
fructuations
like
this.
B
B
And
this
shows
the
actual
integration
example
into
pdk
where
changes
in
multiple
model
parameters
expressed.
This
is
a
DC
model
parameters.
Part
of
the
vision
model
parameters
here
written
here
and
this
this
function
form
is
represented
by
the
process.
Parameters
extract
below
that
those
belong
to
the
big
data
set.
A
B
B
B
Under
politics,
this
is
a
use
case
of
the
designers
point
of
view.
Please
have
a
look
at
the
palette
chart.
This
palette
chart
shows
a
result
with
design
of
experience,
measurement
simulation
results
by
using
the
big
data
and
this
process
fabric.
You
know,
process
oriented
compact
model,
so
from
this
chart
we
can
understand
the
channel
concentration
and
depth
is
the
most
vital
body
of
Earth
by
variable,
and
it
is
also
worth
noting
that
the
second
vital
parameter
is
different
in
two
design.
B
Targets
such
as
voltage
gain
at
one
giga
and
biased
current
over
the
capacitance
is
a
vital
for
S21,
and
one
gigahertz
gain
and
bioscope
for
tox
is
vital
for
the
bias
current
like
this.
We
can
realize
this
realize
the
strengths,
the
strengthen
the
inner
depth
control,
helps
to
enhance
the
robustness
of
this
amplifiers
performance.
B
At
the
same
time,
device
team
can
understand
the
in-depth
controls
informed,
important
and
go
back
to
the
factory
and
optimize
the
process.
This
is
exact,
360,
Sigma,
co-working
environment,
so
that
both
process
and
design
and
Factory
team
can
collaborate
together
in
order
to
obtain
higher
production
yield.
B
So
finally,
I'd
like
to
comment
on
the
future
Technologies
I
think
that
there's
a
lot
of
room
for
DX
technology
to
contribute
the
ecosystem
to
the
same
conduct
of
Fabrications
commentary
data.
No
full,
auto
testers
like
this.
No
full
auto
testers
exist
in
a
world
for
the
experimental
high
frequencies
parameter
measurement.
B
That's
why
I
asked
I
I
asked
Marx
Marcus
to
keep
on
to
keep
an
eye
on
the
email,
incoming
email
from
Mr
Stone
Calif,
and
you
know
that
and
I
have
a
in
order
to
access
the
available
measurement
available
measurement
equipment
in
Japanese
domain
I
I
contacted
the
several
measurement
winter
located
in
Japan
and
they
from
the
beginning.
They
didn't
say
yes,
but
they
said
they.
Okay,
let's
have
a
discussion.
Brainstorming
session,
so
branding's
brainstorming
session
is
scheduled
around
the
middle
of
May.
B
I
did
a
reach
out
of
the
Japanese
academic,
Academia
and
Professor
Joe
KO
joguchi
at
shinshi
University.
He
is
in
favor
of
the
offer
the
workforce
to
Workforce
for
by
some
means,
and
he
is
ready
to
talk,
how
to
cooperate,
how
to
join
our
team
and
he
he.
He
is
ready
to
talk,
how
to
proceed,
how
to
join
in
this
communication
group
and
he
promised
to
send
us
a
list
of
available
measurement,
a
measurement
instrument
in
his
Laboratories.