14 Jun 2023
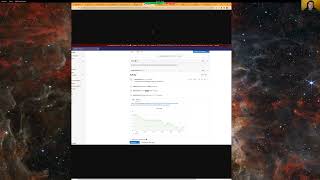
An experiment (proof of concept) using GitLab AI chat/completions endpoints to suggest fixes for some errors.
PoC project - https://gitlab.com/gitlab-org/opstrace/sandbox/poc-ai-errors/
Tracking issue - https://gitlab.com/gitlab-org/opstrace/opstrace/-/issues/2160
PoC project - https://gitlab.com/gitlab-org/opstrace/sandbox/poc-ai-errors/
Tracking issue - https://gitlab.com/gitlab-org/opstrace/opstrace/-/issues/2160
- 1 participant
- 13 minutes

22 Feb 2023
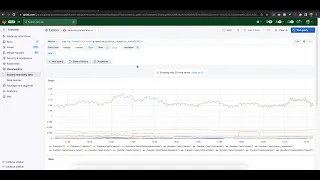
Many customers wonder how they can easily get an overview about their GitLab Self-Managed instance installed via the Omnibus Package. In this Video I am showing how to leverage the internal Prometheus and Grafana of GitLab in order to get a instant overview about your GitLab Instance Metrics.
If you want want to dive right in please see below:
TIMESTAMPS
00:00 Intro and why you should care
00:50 Installation and Setup
01:18 Configure the GitLab Instance with SSL
02:09 Enable Grafana
Links:
https://docs.gitlab.com/omnibus/
https://docs.gitlab.com/omnibus/settings/grafana.html
Further Info:
For those who wonder - the /-/metrics endpoint did NOT show up since my Client IP Address was not whitelisted in the config of GitLab. In order to access the raw-metrics endpoint you need to whitelist it according to: https://docs.gitlab.com/ee/administration/monitoring/ip_allowlist.html
I switched my GitLab Instances accidentally from gitops.art to gitops.fun. Basically everything is running on gitlab.gitops.art :)!
- 1 participant
- 5 minutes


10 Feb 2023
How to use the GitLab Observability Platform to explore metrics stored in an external prometheus instance.
Product direction: https://about.gitlab.com/direction/monitor/observability/
Product direction: https://about.gitlab.com/direction/monitor/observability/
- 1 participant
- 3 minutes
27 Jan 2023
How to use the GitLab Observability Platform to explore errors stored in an external Sentry datasource.
Product direction: https://about.gitlab.com/direction/monitor/observability/
Product direction: https://about.gitlab.com/direction/monitor/observability/
- 1 participant
- 2 minutes


1 Jun 2022
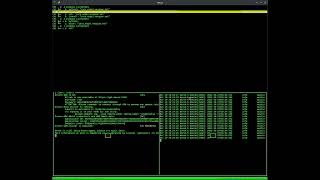
This is a demo of deploying GitLab Observability (Opstrace) locally and using a test application to send and query traces.
This is using our new Golang operator code, GitLab auth, ClickHouse backend and an early version of our Observability UI (Grafana fork).
This is using our new Golang operator code, GitLab auth, ClickHouse backend and an early version of our Observability UI (Grafana fork).
- 3 participants
- 21 minutes


14 Jan 2022
Demo of the current state of the new clickhouse backed tracing in Opstrace
- 1 participant
- 9 minutes
