►
Description
How to use the GitLab Observability Platform to explore metrics stored in an external prometheus instance.
Product direction: https://about.gitlab.com/direction/monitor/observability/
A
Hi,
this
is
a
demo
of
exploring
external
Prometheus
metrics
inside
of
gitlab.
This
feature
is
currently
in
active
development
and
is
only
available
to
a
few
gitlab
team
members
who
are
testing
it.
So,
first
of
all,
what
is
Prometheus
Prometheus
is
the
de
facto
industry
standard
for
recording
metrics,
which
are
typically
indicators
of
application,
health
and
behavior,
so
the
Prometheus
project
actually
provides
a
demo
for
Prometheus
that
we
can
use
to
understand
exactly
what
this
looks
like.
So
here's
a
list
of
metrics,
for
example,
that
I
can
explore.
A
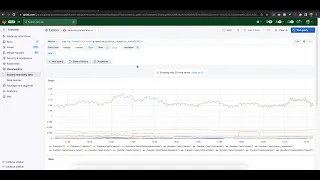
So
here
we
are
I'm
already
getting
some
data,
there's
actually
maybe
too
many
lines
here,
so
I'm
going
to
look
at
the
total
sum.
Instead,
here
we
go
so
we
can
see
that
the
the
number
of
requests
made
to
this
Prometheus
demo
instance
is
somewhere
between
two
and
a
half
and
3.2
in
the
past
hour
or
so.
So.
This
is
a
really
useful
tool,
it's
very
visual,
but
how
could
we
integrate
it
better
into
our
development
workflows?
A
And
this
is
what
we
aim
to
explore
with
the
gitlab
observability
platform,
so
I'm
going
to
go
back
to
gitlab
now,
which
is
where
my
code
lives,
which
is
where
my
plans
my
epics,
live.
My
deployments
Etc
so
I'm
in
the
observability
menu
and
in
data
sources,
I've
already
configured
a
Prometheus
data
source.
All
I
needed
to
do
was
to
provide
a
URL
and
give
it
a
name.
So
I
can
save
and
test
this
and
it's
green.
It
means
it
works.
A
I
can
explore
it,
and
so
you'll
see
that
this
will
look
familiar
and
I
can
already
actually
copy
the
the
query.
I
was
using
and
run
it
within
gitlab
and
I
get
the
same
result
because
I
am
querying
the
exact
same
data
source
so
similar,
maybe
I
even
want
to
look
at
something
different
I
want
to
sum
it
by
Handler
to
see
which
API
endpoints
are
getting
the
most
traffic,
for
example.
Here
it's
the
query
range
followed
by
the
rules
endpoint.
A
So,
as
you
can
see,
similarly,
to
error
tracking,
exploring
your
Telemetry
data
from
within
gitlab
doesn't
require
any
expensive
data
migration.
It
just
works
out
of
the
box
with
your
existing
data
source,
in
this
case
the
Prometheus
public
demo.
So
having
the
capability
within
gitlab
brings
a
lot
of
benefits.
It's
one
less
tool
to
maintain
separately.
It's
easier,
Discovery
I
can
just
go
to
explore
here
on
the
left
side
of
any
project,
and
it's
a
deeper
integration
with
the
rest
of
the
platform.
For
example,
say:
I
have
an
ongoing
incident.