►
Description
No description was provided for this meeting.
If this is YOUR meeting, an easy way to fix this is to add a description to your video, wherever mtngs.io found it (probably YouTube).
A
All
right,
hi
everybody
thanks
for
joining.
My
name
is
ben
williams
and
I
work
with
ncsl
and
welcome
to
ncsl's
virtual
redistricting
seminar.
This
session
is
called
fundamentals
of
map
drawing
and
at
our
in-person
redistricting
seminars,
we've
hosted
a
map,
drawing
simulation
to
give
attendees
a
feel
for
what
it's
like
to
actually
use.
Redistricting
software,
that's
really
difficult
to
replicate
in
this
virtual
setting,
but
we
think
what
we've
figured
out
today
is
the
next
best
thing.
So
during
this
hour
we
have
three
separate
rooms.
A
The
software
vendor
will
act
as
the
operator
of
the
software,
while
the
the
consultant
is
going
to
give
verbal
instructions
to
the
vendor
and
explain
both
visually
and
verbally
the
the
features
of
mac,
drawing
software
that
are
important
for
you
as
redistricters
to
understand
so
in
this
room,
the
redistricting
vendor
is
richard.
Ledbeter
and
aaron
resnick
are
renek
of
esri,
while
the
consultant
is
paul
mitchell
of
redistricting
partners.
Both
of
them
are
good
friends
of
ncsl
and
we're
grateful
to
have
them
with
us
today.
They
have
multiple
decades
of
experience.
A
B
B
Obviously
in
person
the
last
one
I
attended
was
in
columbus,
where
we
were
able
to
do
a
cool
line,
drawing
show
a
big
packed
room
not
going
to
be
doing
that
anytime
soon,
but
the
reality
is
also
that
we're
not
going
to
be
doing
redistricting
in
person
anytime
soon.
So
in
a
way,
this
is
more
reflective
of
the
kind
of
work
that
I
find
myself
doing,
right
now,
working
with
clients
and
trying
to
talk
about
maps
and
data
remotely
and
using
zoom
and
other
technology
to
do
it.
B
Our
work
at
redistricting
partners,
bridges
both
sides
of
redistricting,
in
that
we
do
municipal
redistricting.
Last
night
we
were
doing
the
city
of
long
beach's,
first
independent
redistricting,
commission
meeting
where
we're
the
consultants
we're
doing
a
number
of
cities,
school
districts
and
so
on
in
california
and
in
other
parts
of
the
country.
B
At
the
same
time,
we
do
work
on
the
outside
of
the
registering
process
we
can
get
brought
in
sometimes
by
a
group
like
the
aclu
or
equality
california
has
has
contracted
with
us
to
do
work
around
lgbtq
populations
and
redistricting
other
groups
like
that.
So
in
a
way
we
have
this
ability
to
work
on
the
internal
municipal
redistricting,
with
an
understanding
of
those
groups
and
organizations
that
on
the
outside,
trying
to
influence
the
redistricting
at
the
same
time.
B
B
The
program
that
we're
going
to
go
through
is
obviously
a
very
impressive,
well-known
program,
and
I've
really
enjoyed
the
opportunity
to
kind
of
do
a
couple
pre-calls
with
both
aaron
and
richard,
and
go
through
how
we're
going
to
set
up
this
presentation
so
aaron
richard
you
guys
want
to.
Or
do
you
guys
want
to
introduce
yourself
real,
quick.
C
Sure
my
name
is
richard
ledbeter
and
I'm.
The
global
manager
for
state
government
and
administrative
functions
of
of
government
esri
is
a
gis
vendor.
First
and
foremost,
we
we
focus
on
core
technology
and
it's
kind
of
unusual
for
us
to
even
create
an
end
product
like
redistricting,
but
I'll
have
some
slides
and
you'll
you'll
hear
some
of
the
history
on
why
we're
even
here
aaron.
Let
me
pass
it
to
you.
D
C
C
I
actually
wrote
this
about
15
years
ago,
I
I
saw
where
redistricting
was
a
a
single
seat,
stand
alone
process
and
it
needed
a
better
enterprise
view.
There's
lots
of
assets
that
jurisdiction
estate
or
even
a
local
government,
has
that
helps
define
from
a
cultural
from
a
physical.
From
an
environmental
point
of
view,
these
are
important
aspects
that
need
to
be
brought
into
the
redistricting
process,
so,
ultimately,
openness,
transparency,
citizen
engagement,
is
what
I
would
name
this
product.
If
I
had
to.
If
I
couldn't
use
redistricting
next
slide,
aaron.
C
By
way
of
background,
esri
has
been
involved
in
redistricting
for
a
long
time.
You
probably
don't
know
that,
if
you're,
if
you're,
just
in
the
redistricting
market,
but
we
have
been
involved
with
the
census
bureau
and
the
department
of
justice
in
the
very
early
80s
in
consulting
with
them
to
create
what
would
become
the
pl,
the
public
law
data
format.
C
We
went
on
to
help
the
census
bureau
define
tiger
as
well
from
from
a
geographic
point
of
view
in
the
80s.
Of
course,
it
was
highly
highly
constrained.
Maybe
you
got
two
or
three
scenarios
out
of
that
computer.
In
the
background,
the
90s
again,
the
tools
were
available,
but
it
was
core
technology
you
had
to
create
or
automate
the
workflows
yourself
price
was
a
inhibitor
that
workstation
on
the
on
the
right
side,
probably
cost
you
sixty
thousand
dollars
in
nineteen
ninety
dollars.
C
The
software
probably
cost
another
forty
thousand
dollars
so
in
itself
that
restricted
who
could
actually
participate.
2000
was
that
disruptive
moment.
It's
the
perfect
disruptive
moment
pcs
were
available.
You
could
walk
to
a
big
box
store,
buy
a
piece,
a
computer
that
was
competent
enough
to
run
redistricting.
C
C
C
C
I
like
to
joke
that.
If
there
had
been
rocks
in
the
room,
I
would
have
been
stoned
to
death,
but
that
was
the
state
of
technology.
At
the
time,
microsoft
had
announced
no
more
hard
media.
If
you
want
software,
get
it
from
the
web
and
oh
by
the
way
your
office
products
will
be
delivered
in
a
browser
office.
360.
C
esri
had
to
follow
suit.
So
this
is
how
esri
was
looking
at
all
future
software
in
the
in
the
future,
and
there
are
plenty
of
benefits
by
going
this
route,
not
only
the
same
data,
the
same
software,
the
same
plans
being
able
to
maintain
that
version
control,
as
well
as
just
functionality
and
I.t
and
and
cost
benefits
as
well.
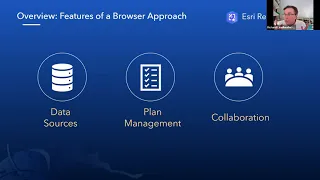
Next
slide,
I
like
to
talk
about
our
product
and
you'll,
be
seeing
these
in
in
aaron's
demonstration
as
he
walks
through
paul's
scenario,
data
sources.
C
Of
course,
the
pl
data,
but
also
by
taking
an
enterprise
approach.
We're
looking
at
your
personal
data,
the
data
the
state
or
the
local
governments
may
have
that
help
contribute
to
the
creation
of
plants,
environmental
data,
the
state
of
south
dakota
uses
watersheds
as
one
of
their
guiding
principles
to
state
legislative
boundaries
so
to
be
able
to
go
to
their
dnr,
see
data
that's
being
published
and
bring
that
into
the
redistricting
scenario.
C
That's
an
enterprise
approach,
plan
management,
keeping
the
same
data,
the
same
software
versions,
the
same
plan
versions
in
sync.
I
was
shocked
in
2010
by
the
amount
of
sneaker
wear
that
still
existed,
where
a
legislator
would
create
a
plan
that
friday
night
at
midnight
and
want
it
reviewed
before
eight
o'clock
in
the
morning
on
a
saturday
and
people
running
around
with
thumb
drives
with
plans
and
trying
to
keep
the
versions
correct.
C
The
third
leg
of
the
stool
is
collaboration,
and
here
is
here's.
Where
esri
is
unique
in
our
approach,
we
provide
you
the
ability
to
collaborate,
not
in
only
in
groups,
you're
covered
ready,
but
but
permission
groups
and
even
open
it
up
to
the
public
and
you'll,
see
that
in
our
in
our
demonstration.
B
B
It's
called
oakla,
it
might
look
like
los
angeles
and
orange
county
jammed
together
to
create
one
state,
but
it's
not,
but
what
we're
going
to
do
is
we're
going
to
do
a
little
bit
of
line,
drawing
where
we're
going
to
go
in
the
the
question
was
really
raised,
as
we
were
putting
this
together,
which
was
how
the
software
works,
but
also
how
does
a
practitioner
or
somebody
that's
going
to
draw
lines?
How
did
how
do
they
develop
strategies
to
actually
draw
the
lines
you
know?
Do
we
look
at
the
data
a
certain
way?
B
B
Some
areas
have
tried
to
mandate
this.
So
what
the
city
of
stockton
in
california
actually
has
a
rule
that
redistricting
is
done
by
census,
track
going
from
the
top
going
down
down
down
until
you
get
equal
population,
then
going
to
the
next
district
and
the
next
district
in
the
next.
It's
not
actually
illegal
or
operative
rule
for
redistricting,
because
it
splits
up
communities
of
interest
and
doesn't
account
for
the
federal
voting
rights
act.
B
B
So
as
we
familiarize
ourselves
with
the
screen
to
start
we'll
recognize
that
there
are
certain
tabs
and
icons
in
these
tools
that
will
allow
us
to
you
know
dive
in
and
do
the
things
that
we
want
to
do
and
as
we
go
through
this
process,
I
think
naturally
we're
going
to
have
aaron
clicking
on
things,
and
he
can
talk
about.
Why
he's
using
a
certain
tool
to
do
something.
B
B
So
we
can
see
that
as
kind
of
like
as
a
starting
point
as
we're
drawing
one
other
thing.
That's
always
interesting,
too,
is
look
at
the
grid
structure
in
the
middle
of
orange
county
versus
in
the
southern
orange
county,
where
all
those
streets
are
squiggly
lines,
meaning
that
they're,
you
know,
probably
more
suburban,
neighborhoods,
more
hillside,
neighborhoods
and
so
on,
and
all
of
that
will
come
into
how
we
decide
to
draw
lines
aaron.
What
demographic
element
do
you
want
to
throw
in
first
for
us
to
look
at.
Could
you
look
at
something
like
latinos.
D
B
And
if
we
maybe
go
back
and
turn
it
off
and
on
a
couple
times,
we
can
see
that
that
darkest
blue
is
santa
ana
right
there
in
the
middle
and
then
the
to
the
east
to
the
west
of
that.
In
long
beach,
you
have
another
kind
of
darker
blue
splotch
as
well
right
and
do
you
have
the
cbap
data
for
latinos
as
well.
B
B
So
now
you
can
see
something
else
here
where
you
can
see
not
only
the
area
that
has
that
higher
voting
age,
population
latino,
but
also
the
the
density
within
that.
So
we
definitely
have
that
one
element:
let's
look
at
asian,
let's
see
if
you
have
asian
in
that
other
vap
the
what
what
I
would
usually
call
citizen
voting
age
population
bap,
but
I
think
you
guys
call
it
the.
D
B
B
Perfect,
so
one
thing
that
if
we,
you
could
even
show
that
as
an
interesting
thing
when
you're
looking
at
the
total
raw
number
of
the
vap
asian
you're,
not
getting
as
much
of
that
picture
that
you
need,
as
when
you
do
this
percentage.
And
now,
when
we
do
that
percentage,
we
see
that
one
area
that's
to
the
west
of
our
santa
ana
area,
that
has
that
heavy
asian
population
and
even
like
a
core
that
is,
is
extremely
asian.
B
We
have
two
asian
populations
in
this
orange
county
area
or
the
oc
area,
which
is
interesting,
and
since
I
know
this
area,
if
we
were
to
dig
in
further,
we
would
find
that
the
area
he's
that
aaron's
looking
at
right
now
with
the
mouse
is
actually
heavily
vietnamese
and
the
area
on
the
other
side
of
that
latino
portion.
Where
you
see
the
larger
shapes
and
lots
of
density,
that's
actually
more
chinese,
less
vietnamese,
more
the
community
around
irvine
and
uci.
B
So
we'll
suppose,
for
the
purposes
of
this,
this
exercise
that
we've
received
community
of
interest.
Testimony
stating
that
there's
really
a
core
community
of
interest
in
the
vietnamese
population
and
that
they
don't
want
to
be
have
their
vote
voting
strength
diluted
by
being
drawn
in
with
other
asian
populations.
They
want
to
try
to
have
their
strength,
reinforced
right
there,
where
they
are.
B
D
C
B
They
go
interesting,
okay,
great!
So
let's
look
at
that
real
quick,
because
we
see
something
in
this,
this
school
district
boundary
right
where
we
were
honing
in
on
that
concern
about
the
asian
population
and
the
latino
population,
and
as
we
know,
when
we're
redistricting,
we
need
to
use
traditional
redistricting
criteria.
B
Equal
population
following
the
federal
voting
rights
act,
other
communities
of
interest
and
in
states
like
california,
there's
a
an
underlying
you
know:
protecting
governmental
boundaries
or
protecting
cities,
keeping
entities
whole,
and
so
we
see
something
in
that
split
between
the
santa
ana
area
and
that
vietnamese
population,
that's
garden,
grove
westminster
fullerton.
Can
you
zoom
in
a
little
bit
on
that
line
right
there,
and
we
can
look
at
that?
B
B
B
B
There
was
a
lawsuit
against
the
city
of
santa
ana
to
require
them
to
draw
a
council
district
that
would
empower
the
vietnamese
community
in
the
city
of
santa
ana
and
stop
a
a
plan
that
had
been
in
place
for
a
long
time
that
split
this
left
side
of
the
city
into
three
districts,
thereby
denying
vietnamese
population
opportunity
to
elect
a
candidate
of
choice
in
santa
ana.
So
we
know
from
that
testimony
that
we
want
to
draw
our
first
district.
Let's
look
at
drawing
a
federal,
federally
voted
voter
right
act.
B
Voting
rights
act
required
santa
ana
district,
that
is
latino
and
then
the
first
thing
we'll
do
to
adjust
it
down
to
size
is
to
take
away
extricate
out
that
portion
of
santa
ana,
that
is
in
the
more
vietnamese
population.
So
if
we
select
just
the
city
of
santa
ana
and
create
that
as
district
x,
you
want
to
name
it
whatever
you
want,
let's
look
and
see
what
that
looks
like.
D
B
We
in
order
to
get
started
where
we
now
have
created
this
new
district,
but
our
goal
population
in
this
entity
is
325
000
we're
going
to
do
40
districts
in
this
area,
not
all
40
today,
so
that
don't
worry,
we're
not
going
to
sit
here
and
draw
40
districts
and
it'll
take
hours,
but
we
have
that.
Can
we
look
at
the
ethnic
population
of
that
as
you've
drawn
it
right
now,.
D
B
Bring
in
other
reference
layers
looks
like
that's
the
completed
district
right,
yes,
okay,
this
is
like
one
of
those
cooking
shows
a
little
bit,
so
let's
go
back
and
let's
look
at
the
what
happens
if
we
take
the
time
to
straw
that
district
three
pull
away,
that
asian
population
maximize
the
latino
voting
power
of
that
district,
three
around
that
santa
ana
population
and
fill
in
any
of
those
little
holes
in
the
city
boundaries,
because
the
city
boundary
has
little
islands
and
make
our
district
three.
What
does
that
look
like.
B
D
B
C
B
D
B
Let's
utilize
existing
boundaries,
major
roads,
the
highways
where
we
do
want
to
make
some
of
santa
ana
go
into
another
district,
where
it's
more
of
a
higher
density
of
asian
and
can
give
them
a
greater
opportunity
to
protect
or
to
elect
candidates
of
choice.
We
lean
back
on
an
actual
lawsuit,
actual
racially
polarized
voting
analysis
that
shows
that,
without
that
district
being
drawn
in
that
way,
that
the
asian
community
would
be
denied
as
a
protected
class,
a
a
fundamental
voting
right.
B
B
We
can
do
it
with
greater
confidence
that
we're
not
going
to
find
ourselves
five
districts
into
it.
Having
made
a
decision
about
how
we
draw
a
hillside
community,
which
is
not
a
voting
rights
act,
protected
issue,
people
live
in
hillsides
versus
the
beach
making
decisions
down
there
that
are
kind
of
less
important
and
impacting
your
ability
to
draw
those
federally
required
maps
in
the
middle
of
orange
county.
B
If
you
live
in
that
inland
portion
or
if
the
residents
live
in,
that
inland
portion
and
they're
going
to
a
mall,
are
they
going
to
fashion
village
or
whatever
it
is
down
in
in
laguna
or
newport,
or
are
they
driving
out
to
the
moreno
valley?
The
answer
is
they're
not
driving
out
to
the
moreno
valley.
The
community
of
interest
for
that
area
is
going
to
be
down
what
I
think
is
silverado
canyon,
and
it's
going
to
go
down
towards
the
ocean
they're
going
to
be
more
residents
of
orange
county
than
they
are.
B
You
know
san
diego
riverside.
They
might
go
down
the
ocean
side
or
something
like
that.
They
might
go
down
to
san
diego
area
from
time
to
time,
but
their
more
direct
community
of
interest
is
back
into
orange
county.
So
we'll
draw
a
district
there
that
tries
to
get
the
population
equality
right
and
tries
to
utilize
the
existing
cities,
geographic
boundaries
and
so
on
to
get
there
seems
like
you're
feeling
it
filling
in
this
thing,
pretty
good.
B
Zoom
in
there
it's
what
you're
doing
next,
because
that's
exactly
where
I
wanted
to
go
next
was
as
we're
drawing
this
boundary.
When
we
get
into
the
city
into
the
greater
density,
we
start
to
see
things
like:
there's
the
five
freeway,
the
405,
the
55,
these
different
freeways
that
act
as
natural
physical
boundaries
kind
of
like
a
river
do.
B
So
this
district
here
is
going
to
take
in
kind
of
the
arrested
development
area
of
orange
county.
The
banana
stand
is
in
that
district.
So,
if
you're
a
fan
of
arrested
development,
but
that
is
essentially
creating
a
district,
it
will
still
have
in
portions
of
it
a
higher
latino
or
asian
population,
but
it
doesn't
have
a
latino
or
asian
population
that
would
add
to
the
the
numbers
for
districts
three
or
district
four
and
district
three
or
district
four.
Don't
really
have
any
room
to
take
in
more
population
anyway.
B
B
B
B
That's
another
thing
I
was
I
you
weren't
doing
that
earlier
and
I
was
going
to
suggest
that
the
one
of
the
great
things
about
these
tools
is
you
can
avoid
having
like
little
gaps
between
districts
by
locking
districts
and
then
drawing
using
bigger
circles
in
order
to
just
say,
like
everything
that
is
in
this
area.
That
is
not
one
of
these
fixed
districts,
just
like
that
and
you're
going
to
do
that
and
you're
going
to
grab
little
bits
of
population
from
census
blocks
that
were
kind
of
missed
by
the
more
targeted
stuff
like
that.
B
Okay,
so
let
me
just
do
two
things
here
that
we
want
to.
We
want
to
hit
pause
and
we
want
to
look
at
two
things:
real,
quick
one
is:
let's
go
back
to
turning
on
that
asian
layer
in
the
latino
layers
and
let's
see
where
we're
headed.
What
what
what
kind
of
trouble
are
we
headed
into
here?
What
choppy
waters
do
we
expect
coming
up
here.
B
B
B
B
Let's
go
back
to
asian
real
quick
again,
and
can
we
explore
in
one
of
those
knobs?
Let's
say
the
one
right
there
left
of
chino
hills
that
that
is
got
a
little
bit
bigger
blocks
upper
right
hand,
corner
there.
That
area!
Can
we
look
at
drawing
something
there
and
seeing
if
we
even
have
like
enough
population
there
to
draw
a
district.
B
Yeah
get
be
generous,
though.
Let's
see
how
big
it
is.
What
we
want
to
look
at
is
it
looks
like
we
might
be
able
to
get
an
area
there
that
might
be
majority
minority
asian.
We
don't
know,
but
are
there
actually
enough
people
there
to
make
a
district
there
and
if
we
do
make
it
bigger,
like
that,
does
the
density
of
asian
get
too
weak
to
actually
make
a
district
that,
let's
see
that.
B
B
We
need
to
recognize
that
if
we
go
willy
nilly
through
this
part
of
la
or
and
and
and
draw
districts
just
based
on,
whatever
criteria
comes
to
mind,
we
could
be
in
a
situation
where
the
api
community
comes
to
us
with
a
lawsuit
saying:
look,
you
missed
a
chance
to
draw
a
very
obvious
majority
minority
asian
district.
There
we
can
see
just
from
the
experiment,
we've
done
that
that
does
not
appear
likely.
So,
let's
back
up
a
little
bit
and
let's
go
to
other
ways
that
we
can
draw
a
line.
D
B
B
When
people
learn
about
redistricting
one
of
the
first
things
they
learn
is
about
things
being
contiguous,
and
we
know
that
this
is
a
population
that
is
contiguous
only
to
a
bunch
of
fish
and
water.
So
what
are
we
going
to
do
with
that?
So
a
quick
google
search
would
find
that
this
island
has
ferries
that
bring
it
back
to
the
mainland.
B
B
So
when
we
draw
long
beach,
let's
draw
a
long
beach,
but
what
I
would
want
to
do
is
draw
long
beach
and
let's
shy
away
from
getting
up
into
that
african-american
population.
Much
and
let's
shy
away
from
getting
up
into
that
latino
population.
Much
and
maybe
let's
draw
a
long
beach
and
just
cut
it
back
into
orange
county
a
little
bit
where
we
had
just
like
that.
B
Don't
hold
me
accountable
for
any
of
this
stuff
that
we
in
this
fictional
area
create
pathways
for
us
to
ultimately
be
successful
in
drawing
the
next
districts,
and
if
I
were
drawing
this
plan
for
all
40
districts,
I
would
probably
at
this
point
step
back
entirely
and
say:
look
I
don't
want
to
mess
anything
else
up.
Let's
go
in.
Let's
look
at
those
voting
rights
act
potential
areas.
B
Let's
make
sure
that
we
have
the
testimony
and
the
kind
of
legal
structure
behind
the
need
for
for
the
for
those
voting
rights
act
districts
and
let's
move
forward.
Somebody
just
texted
me
that
it's
san
clemente
island,
the
one
south
of
santa
catalina,
so
somebody
who's
watching
this
knows
more
than
me
about
the
islands
of
los
angeles
county.
B
B
There
are
some
elements
of
this
plan
that
probably
would
get
blown
up.
There
are
other
elements
of
this
plan
that
are
kind
of
consistent
with
the
kind
of
things
that
you'll
see
that
district
20
is
interesting
in
that
what
it
does
is
it's
merging
in
malibu
and
and
then
just
coming
on
the
other
side
of
santa
monica
and
going
up
into
the
valley
a
little
bit
district
34
is
really
like
a
santa
monica
going
into
the
west
side
district,
that
district
16
up
north.
B
That
one
looks
crazy,
but
it
is
something
that
actually
happens
in
redistricting,
where
some
of
the
foothill
regions
will
get
drawn
into
a
separate
district
and
from
some
of
the
more
or
more
urban
regions
below
them
that
have
the
latino
and
asian
density.
So
aaron,
your
your
final
fill
in.
We
could
play
with
it
for
hours,
but
suffice
it
to
say
that
drawing
40
districts
on
a
a
live
zoom
would
probably,
I
think,
strain
the
attention
span
of
most
people
who
are
are
watching.
I
think
with
this.
B
What
we
could
probably
do
is
go
back
to
a
blank
map
or
go
back
to
what
we
were
drawing
earlier
and
have
people
ask
some
questions
and
we
can
start
talking
about
how
things
work.
I
think
the
two
families
of
questions
we
might
have
would
be
things
about
the
tools
themselves,
the
technical
aspects
of
the
software,
and
for
that
I
think,
aaron
you
can
take
a
lead
and
and
and
then,
if
there
are
questions
kind
of
from
the
practitioner
viewpoint.
C
The
whole
area,
you,
you
saw
different
geography
blocks
and
that's
that
helps
in
the
process
by
giving
you
the
right
level
of
selection
to
the
right
visualization
of
what
you
can
see,
and
it
also
helps
in
the
processing
of
making
inappropriate
grabs
of
block
data
when
you're
zoomed
at
the
wrong
scale
and
having
the
process,
rule
your
life
and
wait
and
wait
and
wait
for
data
to
process.
So
that
scaling
is
automatic.
B
And
one
of
the
things
as
a
practitioner
that
that
reminds
me
of
is
that
maybe
it's
just
the
style
I've
developed,
but
I
generally
like
to
work
in
the
data
with
the
data
based
on
what
the
geographic
level
that
the
data
is
actually
in
so
often
times
when
we're
working
with
citizen
voting
age
population
data
as
an
example,
I
might
have
it
written
down
to
the
census
block
level,
but
its
natural
home
is
at
the
census
block
group.
That's
the
data
that
comes
in
census,
block
group.
B
B
If
I
have
custom
data
that
I've
used
where
we
were
looking
at
vietnamese
and
chinese
populations,
and
one
of
my
favorite
techniques
is
to
take
voter
file
data
and
surnames
from
the
voter
file
to
identify
different
asian
subgroups,
that
will
be
point
data
it'll,
be
you
know,
hundreds
of
thousands
of
little
dots,
geocoded
locations
of
each
of
the
voters
with
their
surname
and
then
added
up
to
the
census
block
level.
So
in
that
instance,
my
data
is
residing
in
the
census
block
and
then
built
up
to
the
other
layers.
B
A
A
First
of
all,
I
will
just
say
that
I,
as
someone
who
is
not
by
any
means
an
expert
at
gi
software,
but
it
was
played
around
with
all
of
the
vendors
products
recently.
I
I
really
do
appreciate
working
in
orange,
county
and
la
county,
because
there's
so
many
different
discrete
minority
populations
that
you
can
really
do
some
great
analysis
in
a
quick
amount
of
time.
So
I
didn't
just
for
the
record
everybody.
I
didn't
ask
paul
to
do
that
paul
and
richard
and
aaron
chose
that
on
their
own.
So
just
thank
you.
A
You
exist
right
of
course,
right.
I
don't
know
if
you
saw
zach's
comment,
but
zach
wants
you
all
to
start
a
twitch
account
where
you
just
do
this
all
day
long
so
but
the
so.
The
the
question
that
was
asked
was:
what
are
some
common
missteps
that
you
all
see
people
making
when
they
initially
set
up
their
software
they're
beginning
to
draw
their
maps.
B
I'll
I'll
take
a
quick
step
from
from
my
experience,
and
it
is
the
I've
seen
people
make
the
huge
mistake
of
just
having
the
wrong
data.
There
was
a
city
nearby
here
that
did
their
own
redistricting
and
I
talked
to
them
at
some
point.
But
then
they
just
had
a
city
staff
person
do
it.
They
drew
a
latino
majority
minority
district
everything
seemed
fine.
They
passed
the
lines
they
were
getting
ready
for
the
election.
B
B
Sometimes
I
like
going
into
areas
where
I
know
really
well,
because
this
fictional
area
I've
ridden
my
bike
hundreds
of
miles
through
this
area.
I've
lived
in
this
area.
I've
driven
through
this
area.
I've
worked
in
this
area.
I've
run
campaigns
in
this
area,
so
almost
every
little
nook
and
cranny.
I
can
tell
a
story
or
I
have
some
kind
of
personal
understanding
of
at
the
same
time.
You
can
be
blinded
by
that.
Sometimes
you
say.
Oh,
I
know
where
this
is.
B
I
know
what's
happening
and
you
over
read
the
data
you
try
to
fit
what
you
understand
to
be
true
about
the
area
into
into
the
data
an
example
of
this
I
I
was,
we
did
the
redistricting
in
the
city
of
davis,
and
there
was
this
area
in
the
north
of
davis,
the
cannery
area.
That
was
a
new
development
and
everybody
said:
hey
there's
that
development
we
need
to
adjust
for
the
future
population.
B
There's
all
this
growth
happening
there,
and
the
reality,
though,
was
that
there
was
more
growth
happening
in
other
parts
of
the
city
where
there
was
greater
density
in
apartments
and
more
people
living
in
individual
apartments
than
before,
and
so
their
perception,
because
they
knew
the
area.
So
well
was
there's
all
this
new
housing,
their
failure
in
in
going
in,
and
not
just
looking
at.
B
The
data
like
for
the
first
time
was
that
they
thought
that
that's
the
only
place
that
growth
existed
because
they
knew
it
because
they
see
it
in
real
life,
so
sometimes
not
having
that
direct
connection
with
the
area
going
into
some
place.
New
means
that
you're,
with
your
virgin
eye,
is
really
kind
of
absorbing
the
data
in
a
different
way.
C
And
and
I'll
dog
pile
on
to
paul
point
about
knowing
the
data
time
and
time
again,
I
talked
to
elected
officials
and
they
they
know
their
district
from
when
they
first
ran,
and
that
district
has
changed
a
case
in
point.
A
friend
of
mine
was
in
a
district
that
when
I
was
growing
up
it
you
know
it
was
completely
separate.
It
was
stepford,
it
was,
but
today
it's
it's
where
the
highest
supported.
C
C
Kathy
you
had
a
question
about
comparing
for
to
a
previous
map.
Yes,
we
could
do
that.
I
don't
know
if
aaron's
set
up
to
do
that
now,
but
you
can
take
multiple
plans,
even
new
plans,
that
two
different
groups
came
overlay
them
and
then
show
me
the
difference
and
up
comes
the
an
image
of
where
plans
are,
are
different
and
in
the
table,
red
and
green
on
how
much
is
gained
or
lost
through
the
various
plans.
B
One
thing:
that's
a
practical
element
of
that
that
is
used
very
commonly
at
the
end
of
the
redistricting
process,
is
calculating
the
accelerations
and
deferrals
when
you're
switching
the
boundaries
for,
say,
city
council,
where
they
have
elections
every
four
years
or
every
they
have
elections
every
two
years.
But
it's
four
year
terms
or
a
state
senate
upper
house
districts
where
you
have
areas
where,
because
the
map
is
changed,
some
people
who
just
voted
for
a
candidate
in
20
now
vote
again
in
22
two
years
early.
B
They
were
accelerated
and
other
folks
who
voted
in
18
didn't
vote
in
20
for
a
state
senate
candidate.
They
don't
get
to
vote
in
22.
They
have
to
wait
till
24
and
so
they're
being
deferred
in
their
opportunity
to
elect
a
candidate
of
choice
and
in
some
states
they'll
have
language
in
the
in
the
redistricting.
B
That
requires
an
analysis
of
those
accelerations
and
deferrals
and
requires
a
numbering
system
that
minimizes
the
accelerations
and
deferrals.
We
have
that
in
the
city
of
long
beach
as
well,
where
we're
doing
the
redistricting,
where
there's
a
requirement
in
the
code
that
the
numbering
system
reduce
the
the
numbers
of
accelerations
and
deferrals.
So
you
have
to
be
able
to
do
that
backwards.
Report
that
richard's
talking
about
at
the
end
of
that
redistricting
as
the
consultant.
C
And
be
cautious
of
the
examples
you
see,
I
I
I
get
angry
when
I
see
examples
or
demos
being
done
on
iowa,
you
know
constitutionally.
They
can
only
use
eight
attributes
where
that's
not
going
to
work
in
the
la
basin,
so
every
state
is
different
and
if
you're
dealing
in
municipalities,
every
municipality
is
driven
by
the
state,
but
they
have
their
own
rules,
so
be
intimate
about
the
area
that
you
know
that
you
need
that.
Your
area
of
interest
is
compared
to
the
demonstration
that
you're
being
that
you're
being
shown.
C
B
C
A
Yep
and-
and
I
will
just
add
for
everyone
that
we
have
a
couple
of
sessions
coming
up
right
after
this-
you
have
two
breakouts
that
you
can
choose
to
do.
You
can
either
go
to
a
class
on
our
session
on
gis
and
the
data
handoff,
which
we
have
some
local
election
officials
and
other
folks
who
often
receive
redistricting
plans
from
states
who
are
going
to
explain
the
problems
that
they've
encountered
working
with
legislatures
and
commissions
in
the
past
and
ways
to
make
that
hand
off
a
little
bit
smoother.
A
C
A
Yeah
well
well
said,
and
I
you
know
if
we
were
in
person,
there
would
be
a
nice
round
of
applause
right
now
for
all
of
you,
and
so
I
I
will
do
my
round
of
applause
as
well
and
know
that
the
oh
delegate,
hal
is
doing
it
too.
So
thank
you
and
we
really
appreciate
you
being
here.
This
has
been
a
lot
of
fun
and
you
know
folks.
I
know
that
paul
and
richard
would
be
happy
to
take
your
questions
in
the
future.